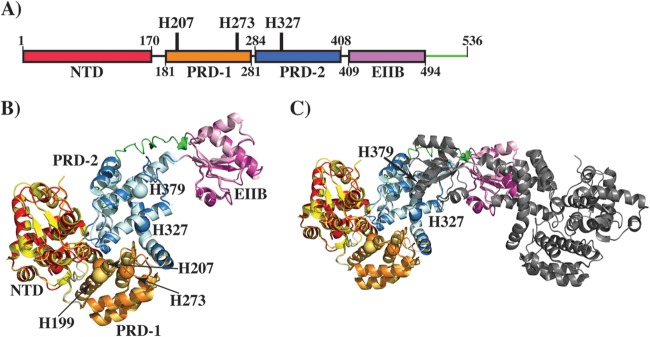
FIG 3.
Modeling studies of Mga. (A) Schematic representation of the domain architecture of Mga. Individual domains are labeled, and the domain boundaries are indicated by the amino acid numbering at the bottom. The locations of phosphorylatable histidines are indicated and labeled. (B) Ribbon representation of the Mga model, as predicted by I-TASSER, superimposed on the structure of AtxA from B. anthracis (PDB accession number 4R6I). Individual domains of Mga are color-coded as shown in panel A. Individual domains of AtxA are color-coded as follows: the N-terminal domain (NTD) is in yellow, PRD-1 is in brown, PRD-2 is in light blue, and the EIIB domain is in light pink. An additional C-terminal fragment in Mga is indicated in green. Phosphorylatable histidines, H207 and H273 of PRD-1 and H327 of PRD-2, are shown as spheres and marked by arrows. A phosphorylatable histidine (H199) in PRD-1 of AtxA is shown as an orange sphere. (C) Ribbon representation of the model of the Mga dimer. One subunit is color-coded as described above for panel B, and the second subunit is shown in gray. The orientation of the model in panel C is tilted and rotated on the x axis relative to that in panel B for a better representation of the dimer.

