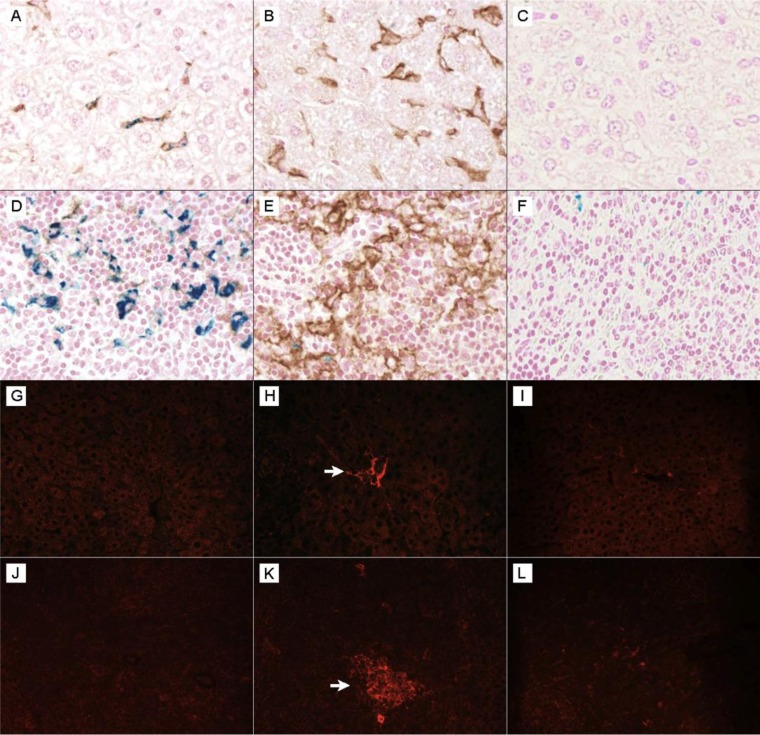
FIG 4.
Increased Fpn1 (brown) expression concurrent with decreased hepatic and splenic iron staining (blue) in anemic Sv129S6 mice after oral infection with S. enterica serovar Typhimurium. (A) Control mouse liver showing iron (blue) within an Fpn1-expressing sinusoidal Kupffer cell. (B) Increased Fpn1 expression in liver Kupffer cells (sinusoidal macrophages) from a mouse at 3 weeks postinfection. (C) Isotype control. (D) Control mouse spleen demonstrating splenic red pulp iron staining (blue) with virtually no Fpn1 (brown) expression. (E) Increased Fpn1 expression in splenic red pulp macrophages and concurrent loss of splenic red pulp macrophage iron staining 3 weeks postinfection. (F) Isotype control with Fpn1 (brown) and Prussian blue (for ferric iron) costaining; original magnification, ×50. Shown is increased intralesional NOS2 expression in spleens and livers of Sv129S6 mice following oral infection with S. enterica serovar Typhimurium. (G) Control mouse liver. (H) NOS2 expression in liver sinusoidal macrophages (Kupffer cells) 3 weeks postinfection. (I) Isotype control. (J) Control mouse spleen. (K) NOS2 expression within splenic red pulp inflammatory lesion postinfection. (L) Isotype control. NOS2 expression was visualized by Alexa-Fluor 594 (red) staining compared with no detectable expression in controls (G and J) and isotype controls (I and L). Exposure times were identical; original magnification, ×40. Arrows identify NOS2+ cells.

