
FIG 8.
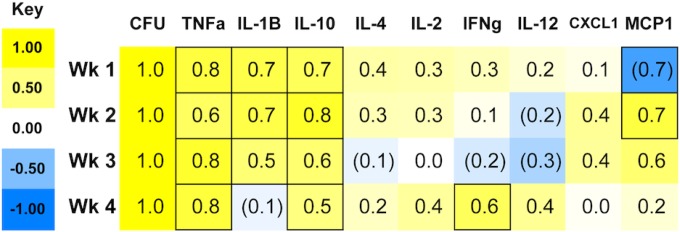
Bacterial load (CFU per gram of spleen) and serum cytokine correlations after oral infection of Sv129S6 mice with S. enterica serovar Typhimurium. The values and shading intensities represent Spearman's correlation coefficients between two traits. The values in the outlined boxes are significant (P < 0.05).