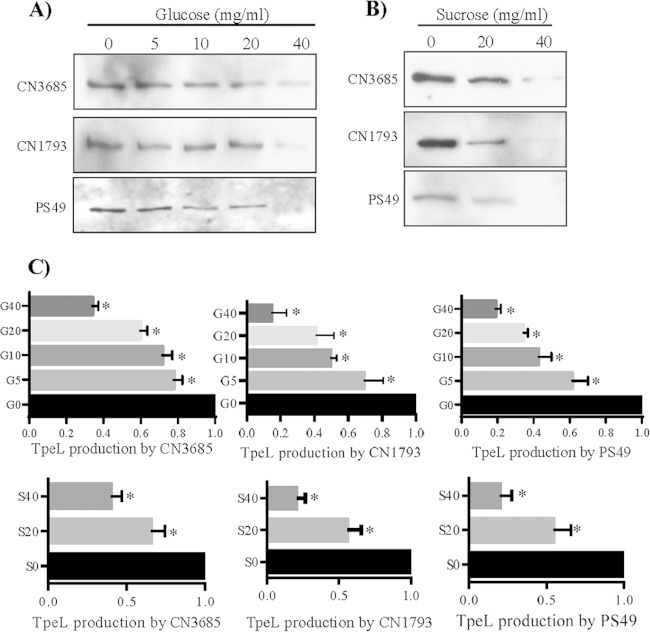
FIG 3.
Comparison of TpeL supernatant levels for C. perfringens cultures grown in TY medium supplemented with different concentrations of glucose or sucrose. (A) Western blot analyses of TpeL levels in supernatants from 8-h TY cultures, which had been supplemented with glucose at the indicated concentrations of CN3685, CN1793, and PS49. Supernatants from matching TY cultures with no supplemental glucose were used as controls. (B) Western blot analyses of TpeL levels in supernatants from 8-h TY cultures, which had been supplemented with sucrose at the indicated concentrations of CN3685, CN1793, and PS49. Matching TY cultures with no supplemental sucrose were used as controls. The immunoreactive protein shown in panels A and B is ∼200 kDa, consistent with the expected mass of TpeL. (C) Quantitative analysis of TpeL supernatant levels from 8-h TY cultures that had been supplemented with different concentrations of glucose (G) or sucrose (S). An asterisk indicates a statistically significant (P < 0.05) decrease of TpeL production in TY supplemented with glucose or sucrose compared to similar cultures without any carbohydrate supplementation. Shown are mean values ± standard errors of the means (SEM) based on three repetitions.

