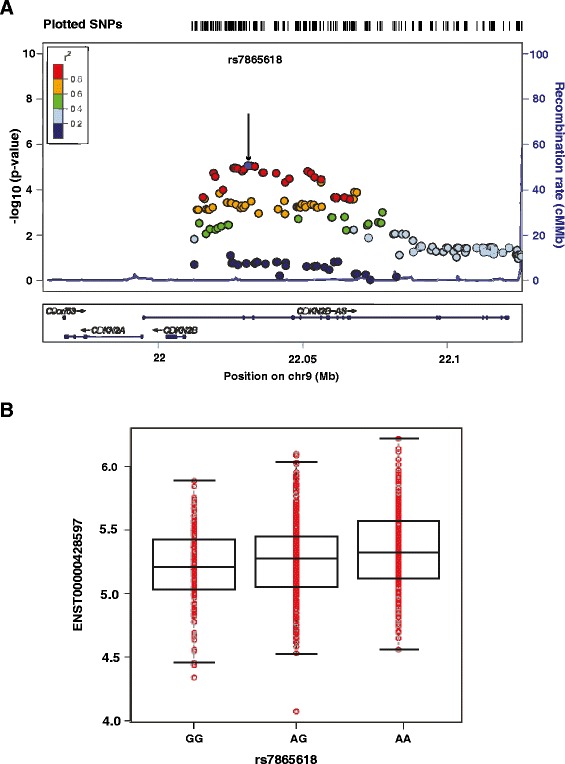
Figure 1.

The association between the ANRIL transcript ENST00000428597 and the SNPs in the Chr9p21 region. A. The relationship between the ANRIL transcript ENST00000428597 and the SNPs in the Chr9p21 region. SNPs are plotted by chromosomal position against the –log(p-value) of their association with the ANRIL transcript ENST00000428597. The most significant SNP is shown as a purple circle, and indicated by an arrow. The SNPs surrounding the most significant SNP are color-coded to reflect their linkage disequilibrium with this SNP as shown in the inset (taken from pairwise r2 values from the 1000 Genomes Project EUR database). Genes and the position of exons, as well as the direction of transcription, are noted below the plots (data from UCSC Genome Browser). B. Plot of the mRNA expression of ANRIL transcript ENST00000428597 and the top SNP rs7865618. The mRNA expression level (log2 scale) is plotted against each genotype and is shown in red. The black boxplot is added on top of the scatterplot to show the median and interquartile range of expression level for each genotype.
