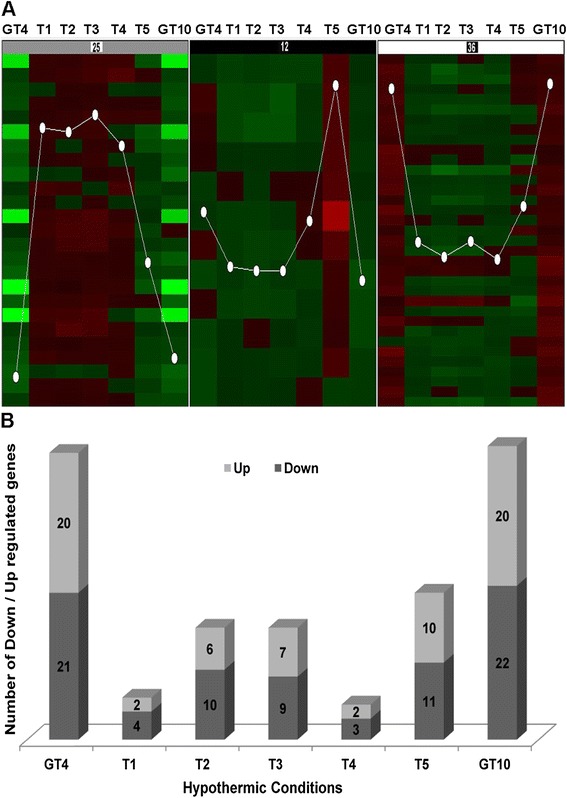
Fig. 1.

Expression profiles of 73 significantly regulated genes (p < 0.005, ≥ ± 1.5 FC) for Arctic Mesorhizobium strain N33. Self-organizing map clusters represent the expression patterns at different suboptimal treatments (A). Histograms showing numbers of significantly expressed genes under various hypothermic conditions (B)
