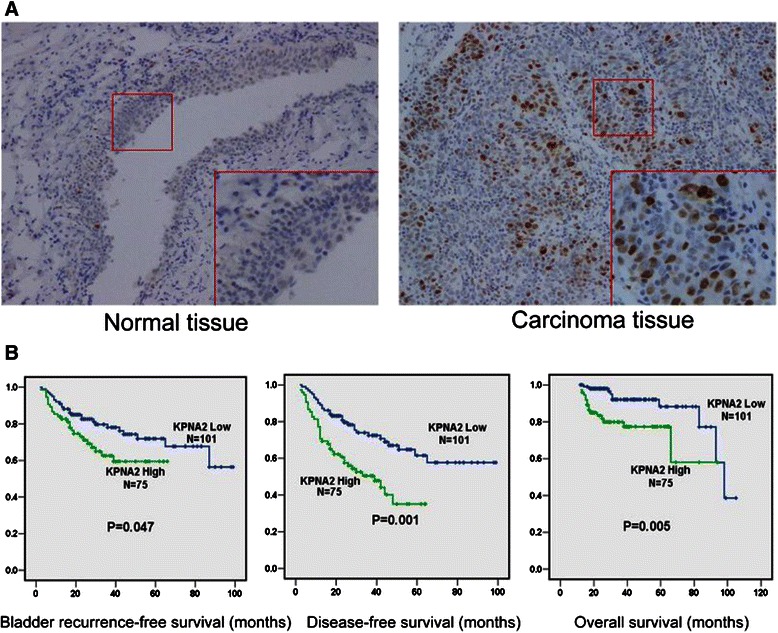
Figure 1.

KPNA2 expression in normal and UTUC specimens and its correlation with survival. (A) Representative micrograph of IHC staining for KPNA2 in UTUC and adjacent normal tissues (Original magnification: ×100; ×200). (B) Kaplan–Meier curves of bladder recurrence-free survival, disease-free survival and overall survival of UTUC patients with high KPNA2 expression versus patients with low KPNA2 expression.
