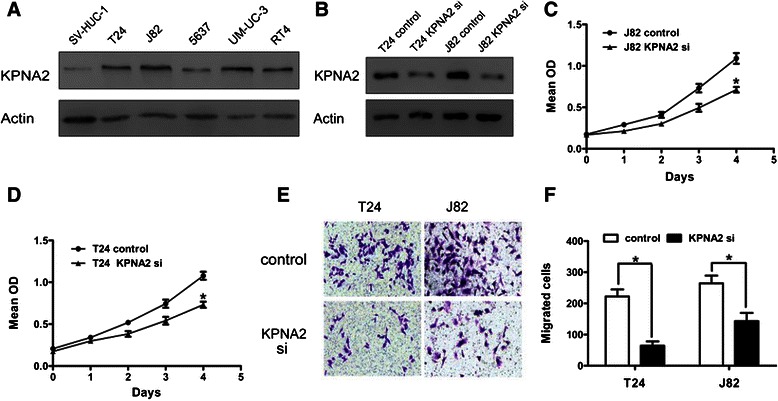
Figure 2.

KPNA2 expression in urinary tract TCC cell lines and KPNA2 knockdown in vitro. (A) Western blot analyses of KPNA2 expression in normal and TCC cell lines of the urinary tract. (B) Western blot analyses of KPNA2 expression in T24 and J82 cells transfected with a control or KPNA2-directed siRNA. (C, D) Proliferation assay results from J82 and T24 cells transfected with a control or KPNA2-directed siRNA. (E) Representative images of migrating cells evaluated by the Boyden chamber assay (Original magnification: ×100). (F) The quantification results for migrating cells are presented as the mean ± SD of three independent experiments, with five random fields counted per chamber. *P < 0.05.
