Figure 3.

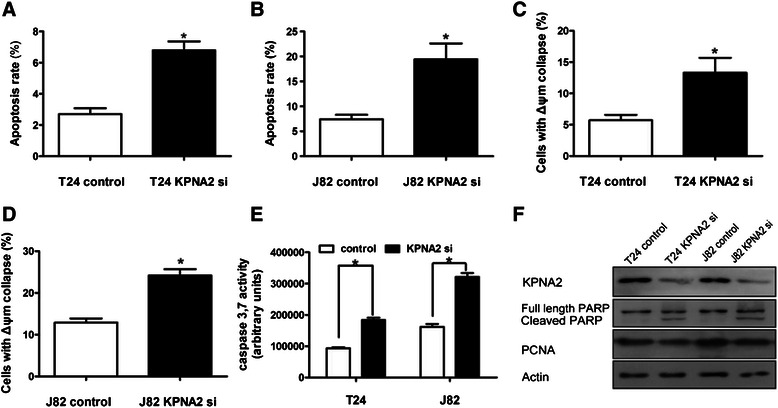
KPNA2 knockdown induces apoptosis in urothelial carcinoma cells. (A,B) The apoptosis rate, as evaluated by flow cytometry analysis using Annexin-V/PI staining. (C,D) The percentage of cells with mitochondrial Δψm disruption, as evaluated by flow cytometry analysis using the JC-1 dye. (E) Caspase 3/7 activity of T24 and J82 cells transfected with control or KPNA2-directed siRNA. The data in (A–E) represent the mean ± SD of three independent tests performed in triplicate. *P < 0.05. (F) Western blot analysis of PARP cleavage and PCNA expression in control and KPNA2 knockdown cells.
