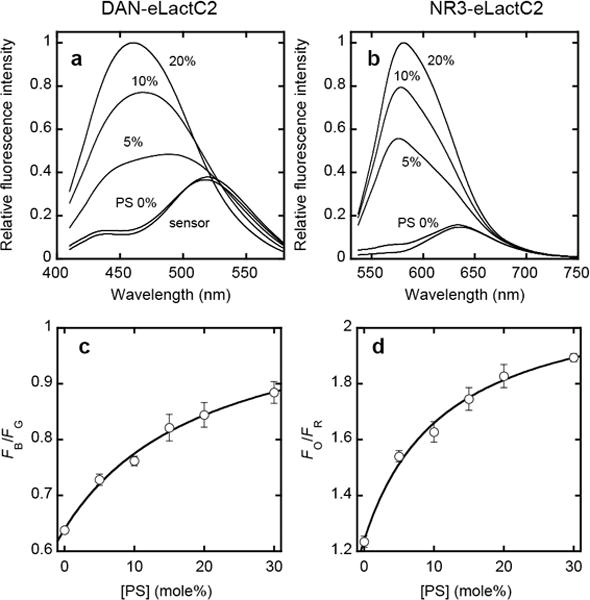
Figure 1.

a–d. Spectral properties of and ratiometric calibration for orthogonal PS sensors. a–b) Fluorescence emission spectra of DAN-eLactC2 (a) and NR3-eLactC2 (b) (both 500 nM) in the presence of phosphatidylcholine (PC)/PS (100-x:x) large vesicles measured spectrofluorometrically. Numbers (x) indicate mole% of PS. The excitation wavelength was 392 nm for DAN-eLactC2 and 520 nm for NR3-eLactC2. Both exhibited a dramatic blue shift upon PS binding. c–d) Ratiometric calibration curves of DAN-eLactC2 (c) and NR3-eLactC2 (d) for PS quantification. The PS sensors were monitored by a two-photon microscope in the presence of PC/PS (100-x:x) giant vesicles. Non-linear least-squares analysis of the plot using the equation (for DAN-eLactC2); FB/FG = (FB/FG)max/(1 + Kd/[PS]) + C yields Kd, (FB/FG)max and C values and the calibration curves are constructed using these parameters. FB, FG, Fo, and FR indicate blue, green, orange, and red channel fluorescence intensity, respectively. Kd, (FB/FG)max and C are the equilibrium dissociation constant (in mole%), the maximal FB/FG value and the arbitrary instrumental parameter. Blue and orange channels depict membrane-bound sensors whereas green and red channels show membrane-bound plus free sensors. Error bars indicate standard deviations calculated from >3 independent sets of measurements. 20 mM Tris buffer, pH 7.4, containing 0.16 M KCl was used for all measurements.
