Figure 3.

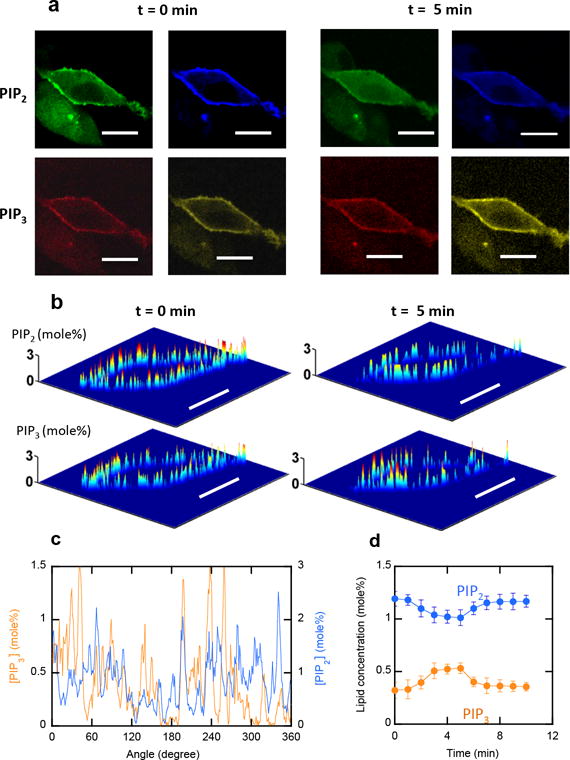
a–d. Simultaneous in situ quantification of PIP2 and PIP3 in the inner PM of NIH 3T3 cells, a) Four-channel images of representative NIH3T3 cells before and 5 min after insulin treatment. PIP2 and PIP3 were monitored using microinjected DAN-eENTH and NR3-eMyoXPH, respectively. Blue and orange channels depict membrane-bound sensors whereas green and red channels show membrane-bound plus free sensors. b) PIP2 and PIP3 were quantified through ratiometric calibration (see Figure S2). c) Angular profiles of PIP2 and PIP3 in the PM at 3 min after insulin treatment. PIP2 and PIP3 show pronounced spatial heterogeneity but a good reciprocal spatial correlation was observed between them. d) Time-dependent changes of spatially averaged PIP2 and PIP3 concentrations in the PM. Scale bars indicate 5 μm.
