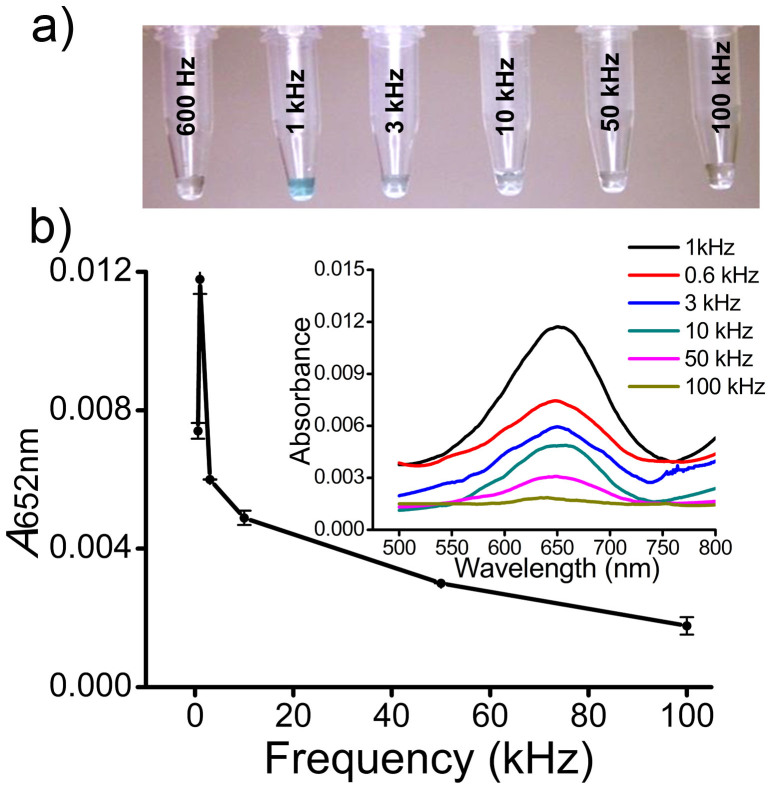
Figure 4. Effect of frequency on protein capture.
(a) Colorimetric detection of HER2 antigen (100 pg mL−1) spiked in serum under the frequency range f = 600 Hz- 100 kHz at Vpp = 100 mV. (b) Absorbance peak at 652 nm (A652 nm) for HER2 (100 pg mL−1) spiked in serum under the frequency range f = 600 Hz- 100 kHz at Vpp = 100 mV. Each data point represents the average of three separate trials (n = 3) and error bars represent standard error of measurements within each experiment. Inset shows corresponding UV-Vis absorption spectra obtained from respective colorimetric solutions.

