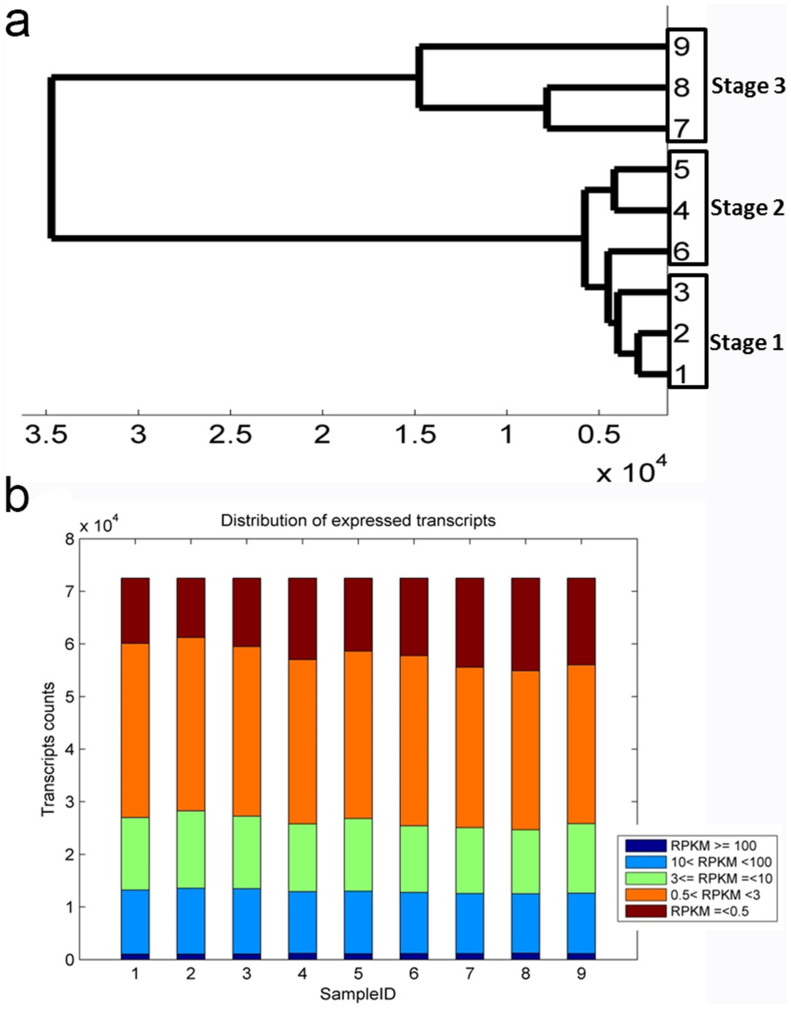
Figure 3. Global analysis of transcriptome datasets of biological replicates and samples.
(a), A dengrogram graph showing global relationships of samples. (b), A bar plot describing number of expressed transcripts after filtering. Samples from 1 to 9 stands for S1-rep1, S1-rep2, S1-rep3, S2-rep1, S2-rep2, S2-rep3, S3-rep1, S3-rep2, S3-rep3.

