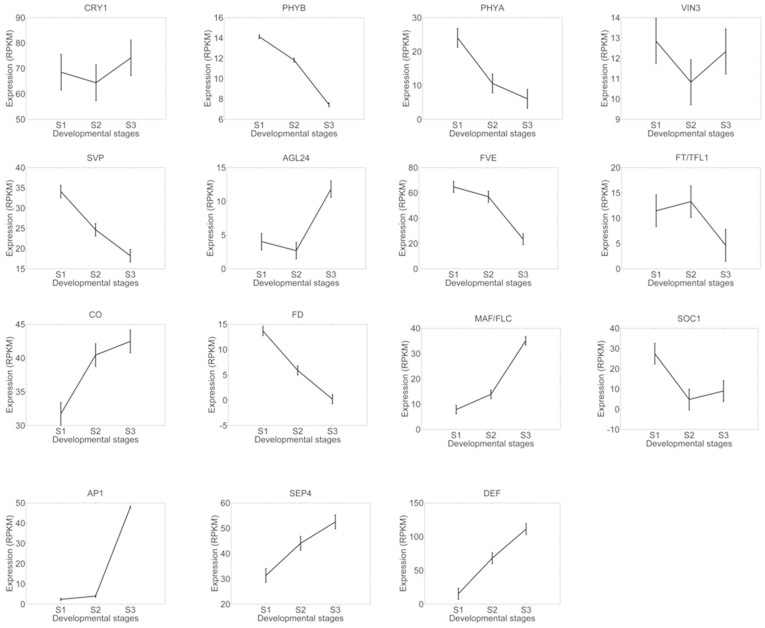
Figure 7. Expression patterns of key flowering regulators.
Gene symbols were derived from TAIR and expression levels of putative orthologs were plotted. The mean values of RPKM of 15 orthologs of cry1, phyB, phyA, VIN3, SVP, AGL24, FVE, FT/TFL1, CO, FD, MAF/FLC, SOC1, AP1, SEP4, and DEF were plotted with standard deviations.

