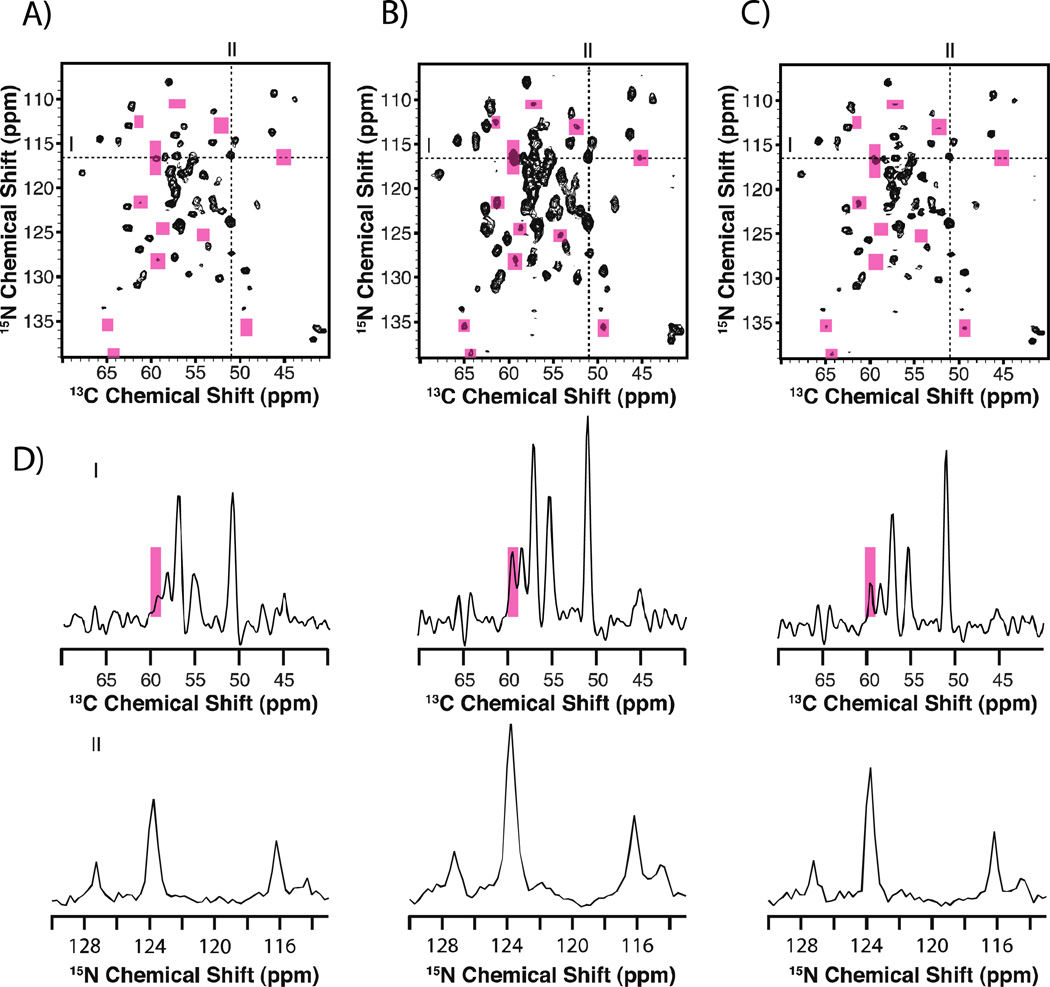
Figure 3.
Comparison of 2D NCA spectra for reassembled thioredoxin collected with US (A) and NUS (B and C). Panel A displays data collected with uniform sampling and processed with MINT. Panel B was collected with NUS and processed with MINT. Panel C shows the same dataset as panel B but processed with line width deconvolution, which improves resolution. The data are displayed at the same contour level. Pink boxes are used to highlight areas where new peaks are present in the NUS spectra. In D), line shapes extracted through the direct and indirect dimensions are displayed and show intensity enhancements for NUS data. Reprinted with permission from Paramasivam et al., J. Phys. Chem. B., 2012, 116, 7416–7427. Copyright American Chemical Society 2012

