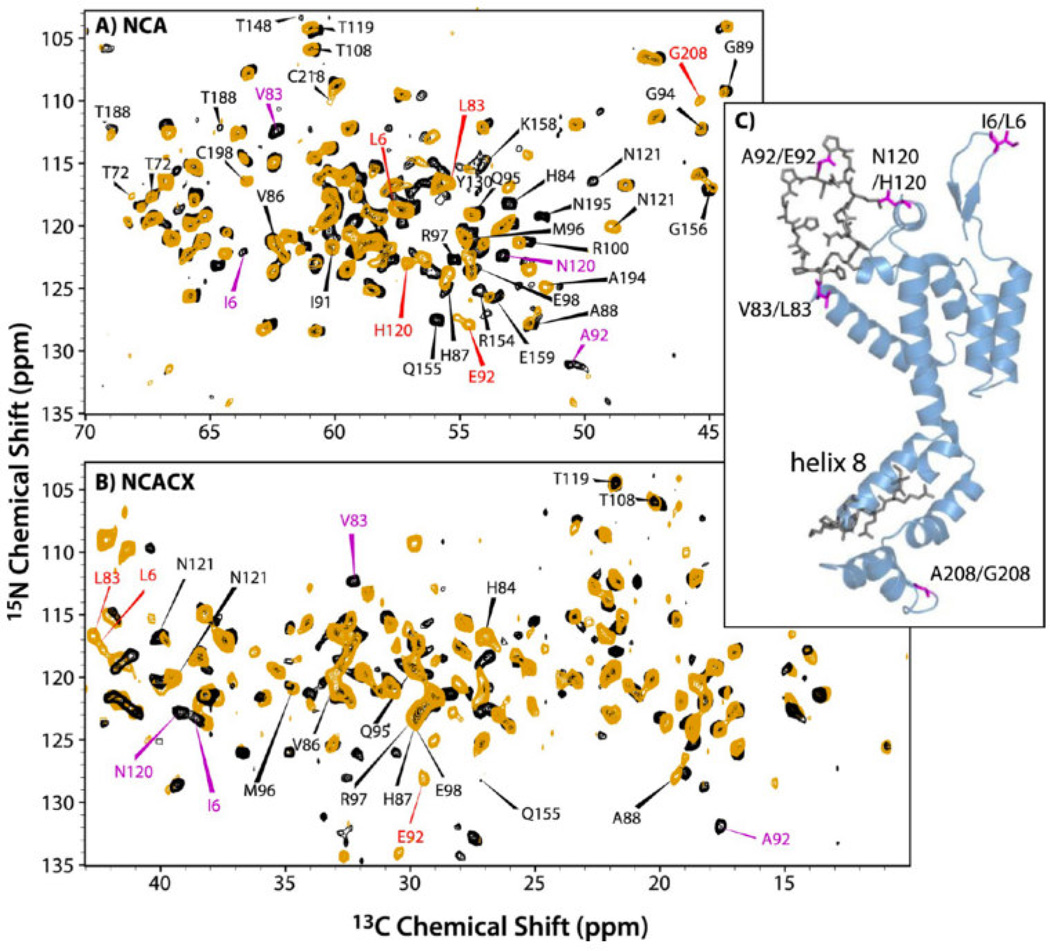
Figure 6.
Overlay of (A) NCA and (B) NCACX spectra of CA NL4-3 A92E (orange) and CA HXB-2 (black). The NCACX spectrum is an expansion of the aliphatic sidechain region. Indicated with red and magenta arrows are distinct resonances observed for HXB2 and NL4-3, respectively, indicating differences in conformation or electronic environment. (C) A view of the 3D structure of CA (HXB2 variant, PDB file 3NTE). Residues highlighted in magenta vary between the two constructs. Residues shown in gray are conserved in the two strains, but exhibit chemical shift differences. Reprinted with permission from Han et al., J. Am. Chem. Soc., 2013, 17793–17803. Copyright 2013 American Chemical Society.

