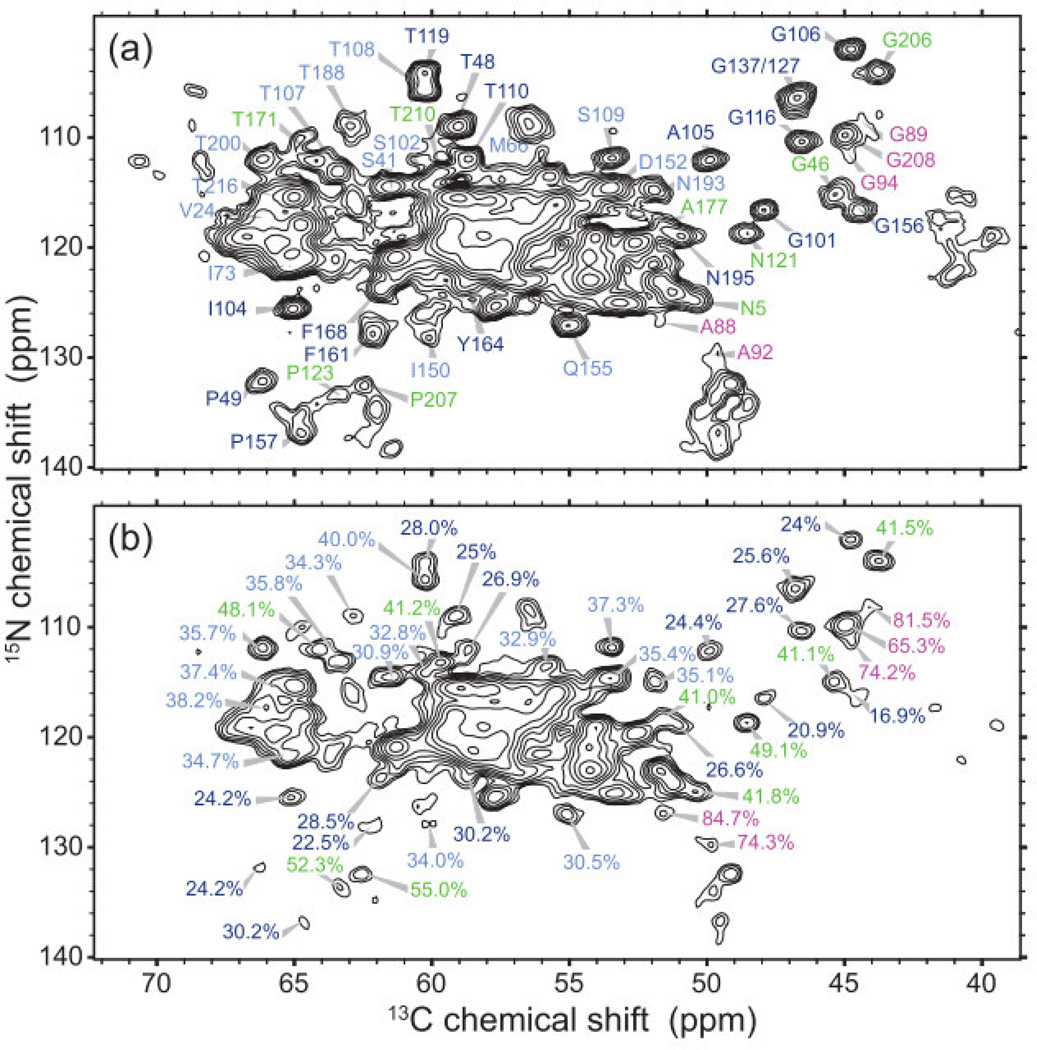
Figure 8.
Indications of mobility in tubular assemblies of CA. (A) Reference NCA spectrum with no T2 filter. (B) 1H T2-filtered NCA spectrum. Percentages represent the remaining peak volume as compared to the reference spectrum. Sites with a greater remaining peak volume are more dynamic, highlighted in green and magenta. Reprinted with permission from Bayro et al., J. Mol. Biol., 2014, 426, 1109–1127. Copyright 2014 Elsevier.

