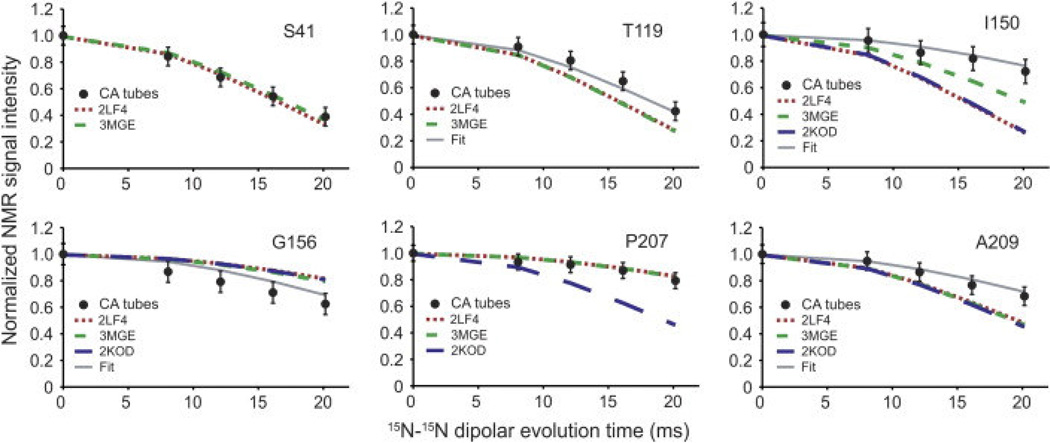
Figure 9.
15N-BARE decay curves demonstrated for 6 residues in tubular assemblies of CA. Experimental decay curves are indicated by filled circles. Broken and dotted lines are simulations based on 3 different PDB structures of CA monomers (green dashed line: 3MGE, red dotted line: 2LF4, blue dashed line: 2KOD). “Fit” indicates simulated curves based on the refined CA structure using the 15N-BARE data as a structural restraint. Reprinted with permission from Bayro et al., J. Mol. Biol., 2014, 426, 1109–1127. Copyright 2014 Elsevier.

