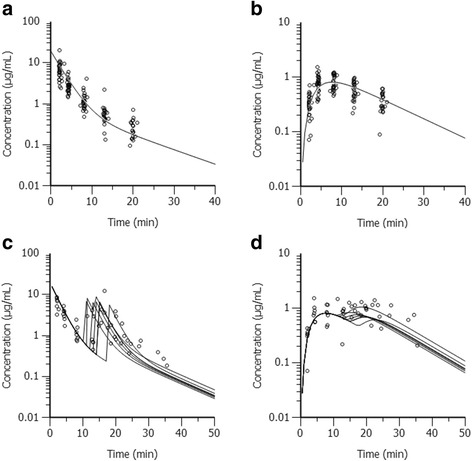
Figure 2.

Plasma concentrations over time of S-ketamine (a., c.) and S-norketamine (b., d.). The circles represent the measured concentrations for S-ketamine (a., c.) and S-norketamine (b., d.) in horses administered S-ketamine only once (n = 21; a., b.), or twice (n = 7; c., d.). In each figure, the continuous lines represent the respective predicted concentrations for S-ketamine or S-norketamine as obtained by the final population pharmacokinetic model (a., b.: graph with mean data of 15 horses as described in Section 3.2; c., d.: individual graphs for the 7 horses).
