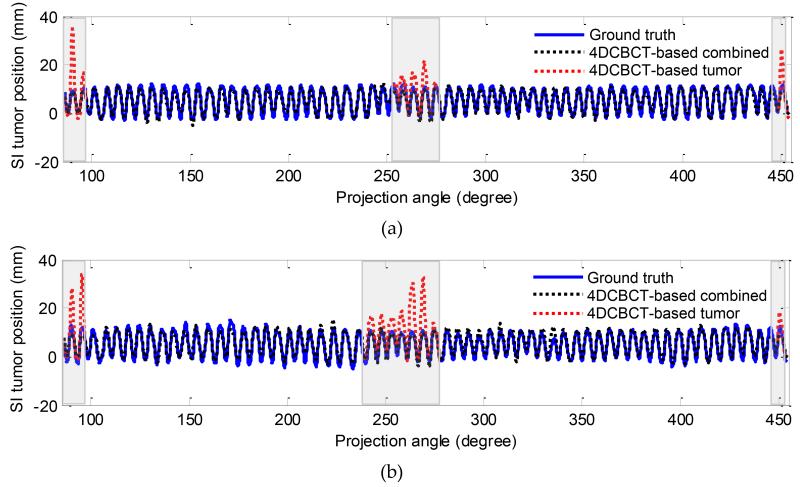
Figure 6.
SI tumor position in the estimated fluoroscopic images using 4DCBCT-based motion models in dataset #1 (a) and in dataset #2 (b). The shaded grey area shows the region in which diaphragm-based tracking was used. The black dashed line shows SI tumor position using combined tracking (i.e., alternating based on tumor and diaphragm tracking). The red dashed line in the shaded grey areas shows SI tumor position when tumor-based tracking was used.

