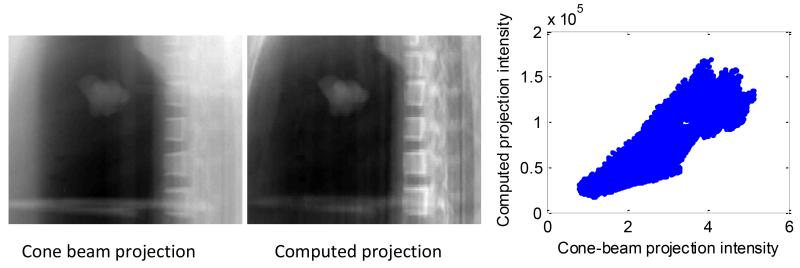
Figure 8.
Measured cone-beam projection after preprocessing of the image intensities (logarithm transform followed by reversion of the sign) (left), computed projection (middle), and scatter plots between the intensities of the two images. A linear model between the two image intensities is able to explain 91% of the variance in the two images.

