
Figure 1.
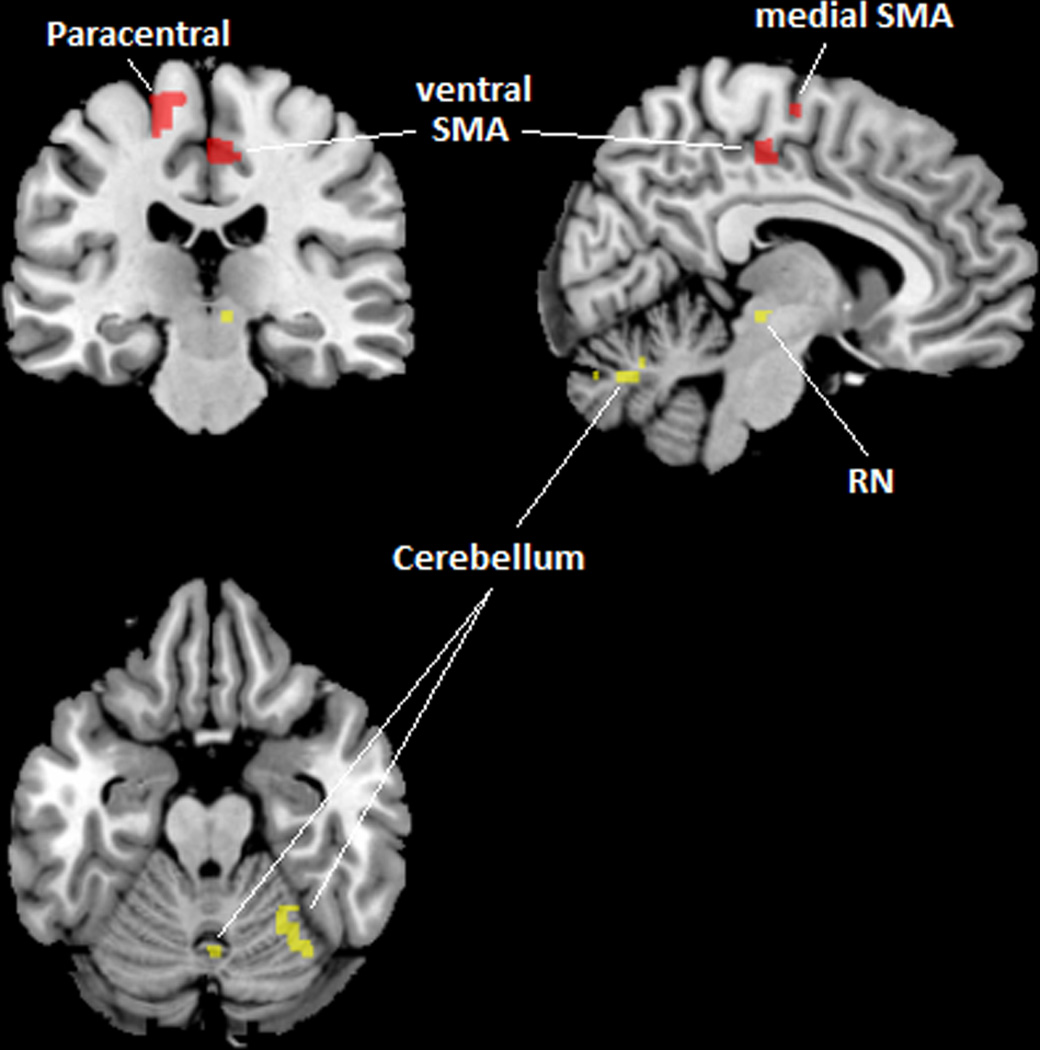
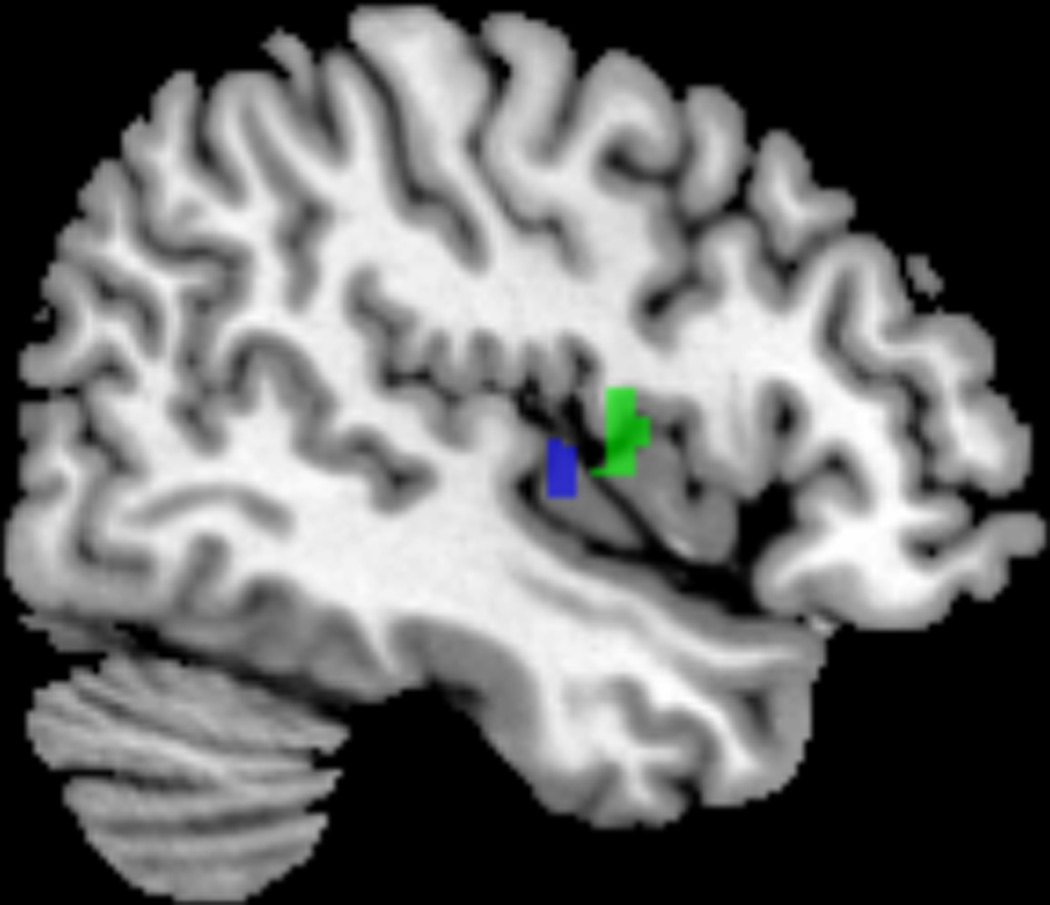
(A) PelMotor, SMA, and paracentral lobule (shown in red) demonstrated increased LF power and increased LF connectivity with a region in the right midbrain (red nucleus) and regions within the cerebellular vermis VI/VII and right lobule VI (shown in yellow) in patients compared to controls. (B) pINS (shown in blue) demonstrated decreased LF power and decreased LF connectivity with mINS (shown in green) in patients compared to controls.