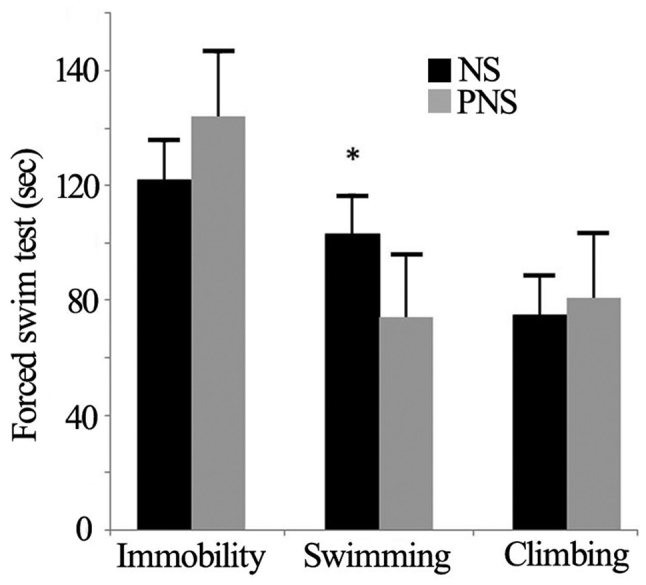
Figure 1.

Behavioral response in the forced swim test. Comparison between NS and PNS offspring (n=10 in each group). Marks indicate a decrease in swimming. Data are presented as means ± SEM. *P<0.05. NS, non-prenatal stressed offspring; PNS, prenatal stressed offspring; SEM, standard error of the mean.
