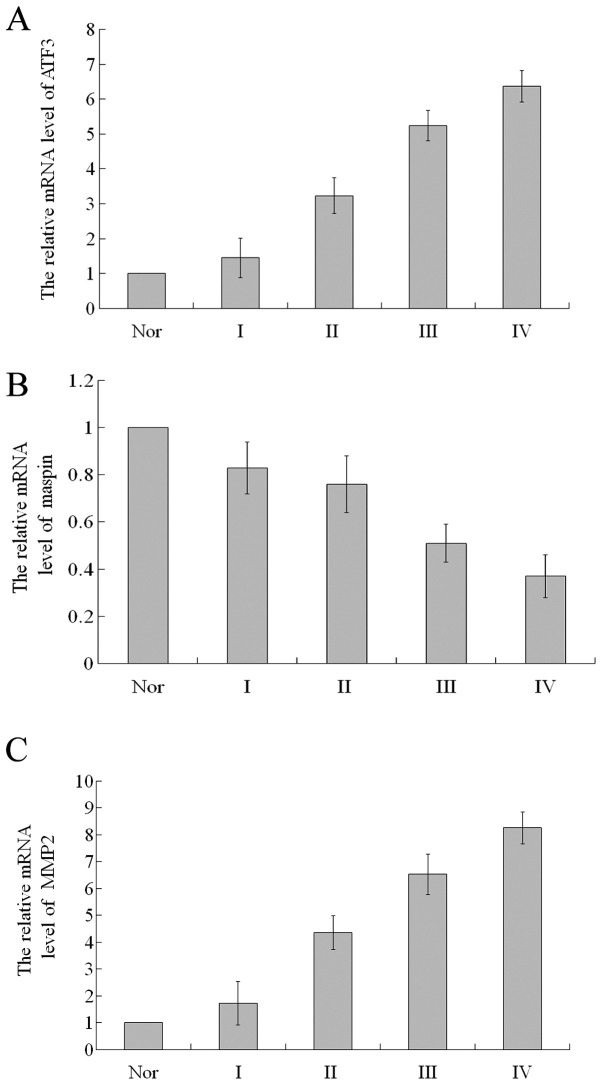
Figure 2.
RT-qPCR analysis of the relative mRNA levels for activating transcription factor 3 (AFT3), maspin and matrix metalloproteinase 2 (MMP2). (A) In grade II–IV glioma tissues, ATF3 mRNA expression gradually increased in relative abundance and was higher than that in normal brain tissue (P<0.05). (B) In grade I–IV glioma tissues, maspin mRNA expression gradually decreased and was less abundant compared to normal brain tissue (P<0.05). (C) In grade II–IV glioma tissues, the relative abundance of MMP2 mRNA expression gradually increased and was higher than that in normal brain tissue (P<0.05). Nor, normal tissue.

