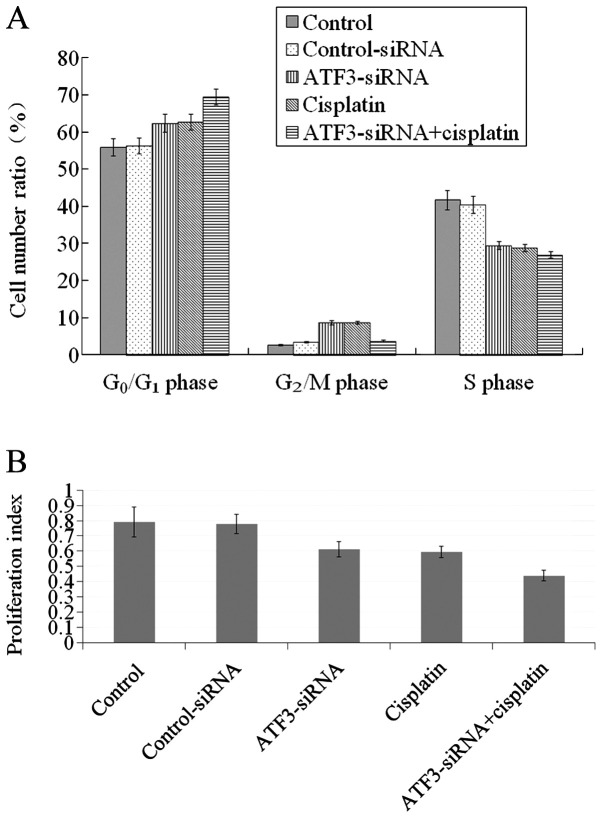
Figure 5.
(A) Cell cycle analysis by flow cytometry. Compared to the cell group and the control-siRNA group, the percentage of cells in the S phase in the activating transcription factor 3 (ATF3)-siRNA group and the cisplatin group was lower (P<0.05), whereas the proportion of cells in the G0/G1 phase was higher (P<0.05). With respect to the ATF3-siRNA group and the cisplatin group, the proportion of cells in the S phase in the ATF3-siRNA + cisplatin group was lower, and the percentage of cells arrested in the G0/G1 phase was greater (P<0.05). (B) Cell proliferation index. Compared to the cell group and the control-siRNA group, the proliferation index for the ATF3-siRNA group and the cisplatin group was reduced (P<0.05), and the proliferation index in the ATF3-siRNA + cisplatin group was much lower (P<0.05).

