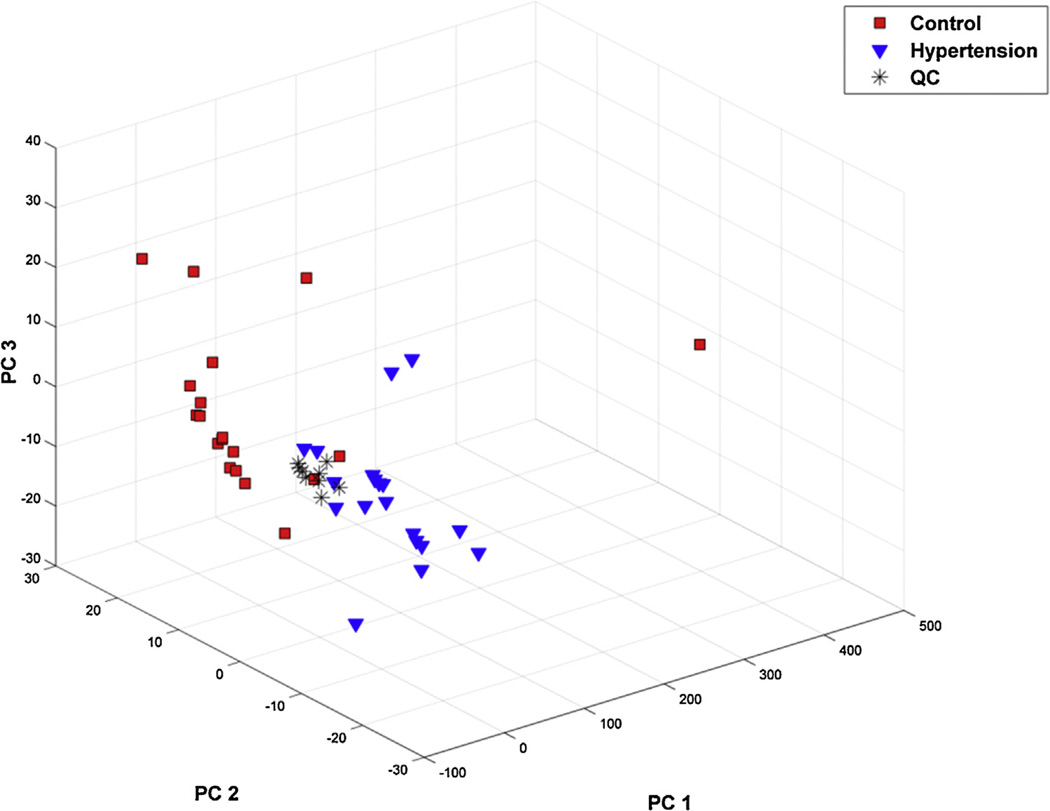
Fig. 1.
Young hypertensive men and healthy controls show different metabolic profiles. PCA scores plot of the metabolic profiling data obtained from plasma of young hypertensive men and healthy controls. Blue triangle, young hypertensive men (n = 20), red square, healthy controls (n = 20), black asterisk, QC samples (n = 9).(For interpretation of the references to color in this figure legend, the reader is referred to the web version of this article.)

