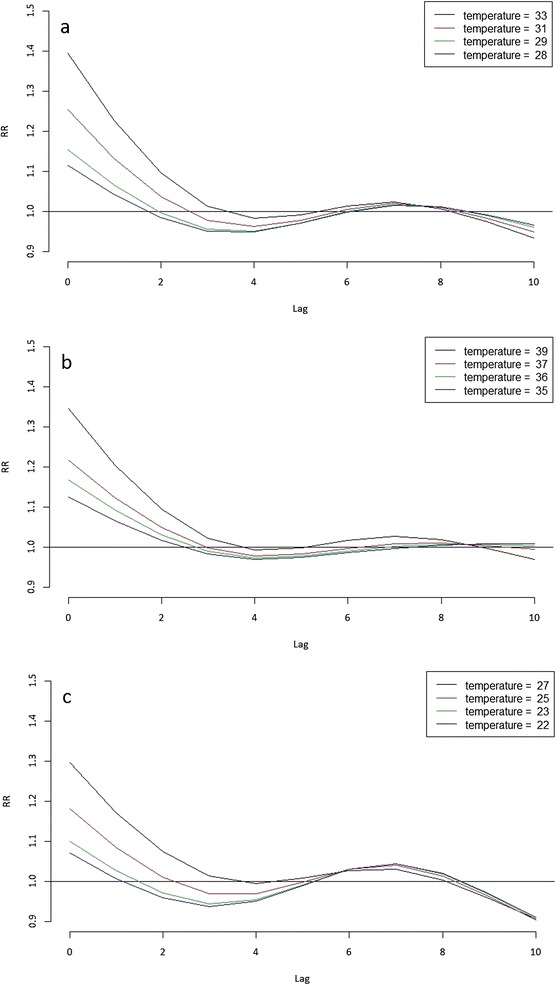
Figure 5.

Lag-specific relative mortality risk associations for aggregated cardiovascular diseases. Legend: Lag-specific relative mortality risk (RR) associations for aggregated cardiovascular diseases at the temperatures corresponding to the 90th (black), 95th (red) and 99th (green) percentiles of the temperature distribution and the maximum value (blue) of the temperature range for: (a) Tmean; (b) Tmax; and (c) Tmin.
