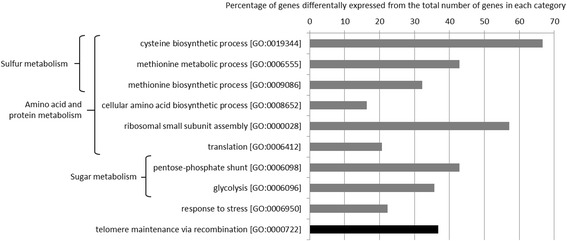
Figure 2.

Classification of genes differentially expressed between the parental strains according to GO Biological Process categories. Bars show the percentage of affected genes from the total number of genes in each category. Gray bars show the categories of genes more strongly expressed in the JN17 strain and black bars show those more strongly expressed in the JN10 strain.
