Figure 6.

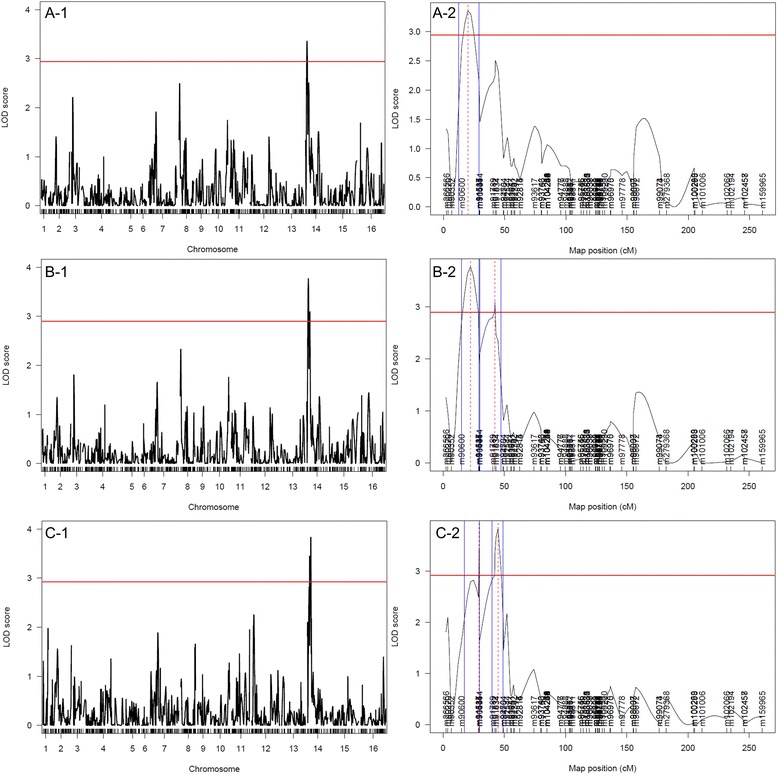
LOD score curves along the chromosomes for SO2 (A-1&2), acetaldehyde (B-1&2), and propanol (C-1&2) production phenotypes. A zoom on chromosome XIV is shown.

LOD score curves along the chromosomes for SO2 (A-1&2), acetaldehyde (B-1&2), and propanol (C-1&2) production phenotypes. A zoom on chromosome XIV is shown.