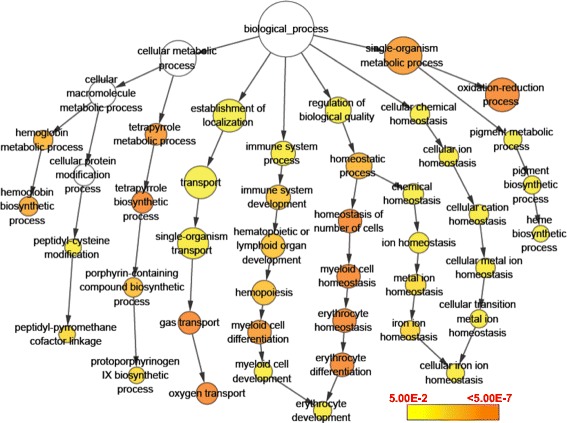
Figure 4.

GO enrichment analysis of genes up-regulated by hypoxia. The size of circles is proportional to the number of genes associated with the GO term. The arrows represent the relationship between parent–child terms. The color scale indicates corrected p-value of enrichment analysis.
