Figure 6.

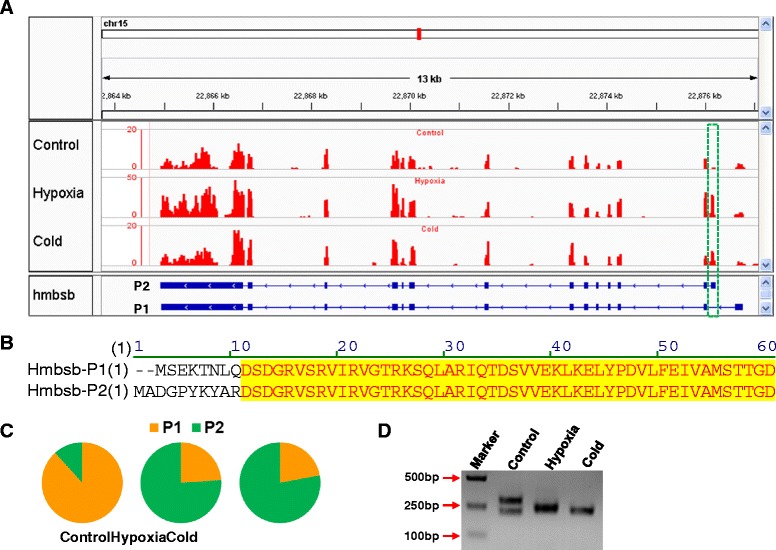
Alternative promoter usage of hmbsb upon hypoxia and cold. (A) Read coverage at hmbsb locus. The upper panel shows the read coverage of representative sample from each treatment group and the bottom panel indicates the structure of hmbsb transcripts. The green box indicates the first exon determined by the alternative promoter. (B) Partial sequence alignment of Hmbsb peptides. (C) Relative abundance of hmbsb transcripts detected by RNA-seq. (D) 5′ ends of hmbsb cDNAs.
