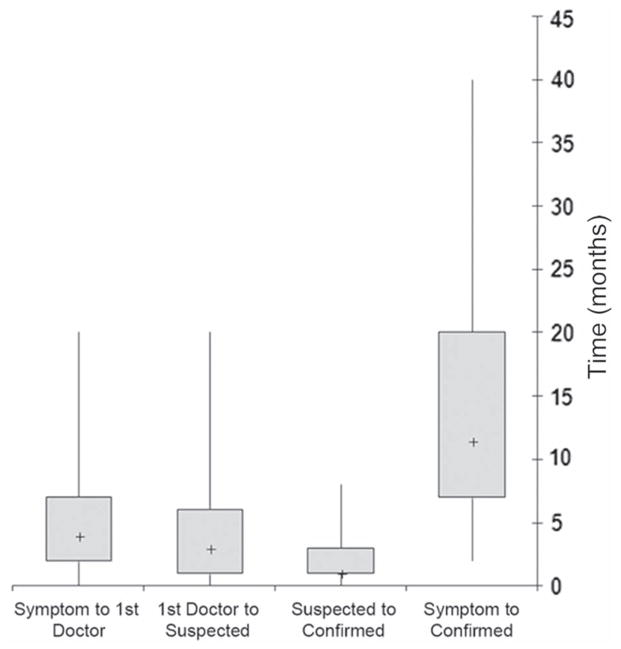
Figure 1.
Diagnostic timelines. Box-and-whiskers plot representing the medians (+), inter-quartile ranges (boxes), and minimum and maximum values (whiskers) of the diagnostic intervals in months. The intervals represented include: time from presenting symptom to first doctor visit, time from first doctor visit to suspected ALS diagnosis, time from suspected ALS diagnosis to confirmed ALS diagnosis, and time from presenting symptom to confirmed ALS diagnosis.

