
Figure 2.
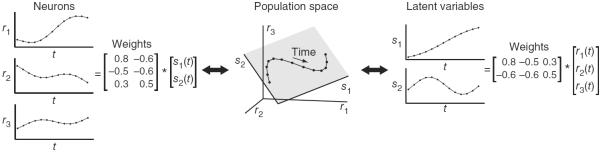
Conceptual illustration of linear dimensionality reduction for three neurons (D = 3) and two latent variables (K = 2). Center, the population activity (black points) lies in a plane (shaded gray). Each point represents the population activity at a particular time and can be equivalently referred to using its high-dimensional coordinates [r1, r2, r3] or low-dimensional coordinates [s1, s2]. The points trace out a trajectory over time (black curve). Left, the population activity r1, r2 and r3 can be reconstructed by taking a weighted combination of the latent variables, where the weights are specified by the matrix shown. Right, the latent variables s1 and s2 can be obtained by taking a weighted combination of the population activity, where the weights are specified by the matrix shown.