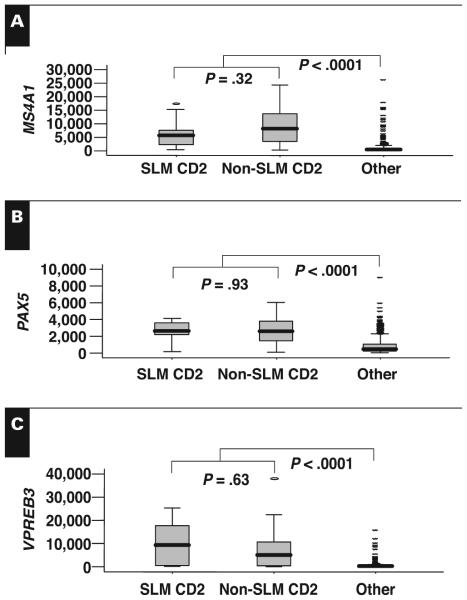
Figure 2.
Box plots comparing the messenger RNA expression of MS4A1/CD20 (A), PAX5 (B), and VPREB3 (C), as determined by microarray, in small lymphocyte–like plasma cell myeloma (SLM) CD-2 subtype (n = 9), non-SLM CD-2 (n = 20), and others (n = 322). Note that there is no significant difference in the expression of these genes within the CD-2 class but that expression is significantly lower in the other classes relative to the SLM and non-SLM CD-2 classes.

