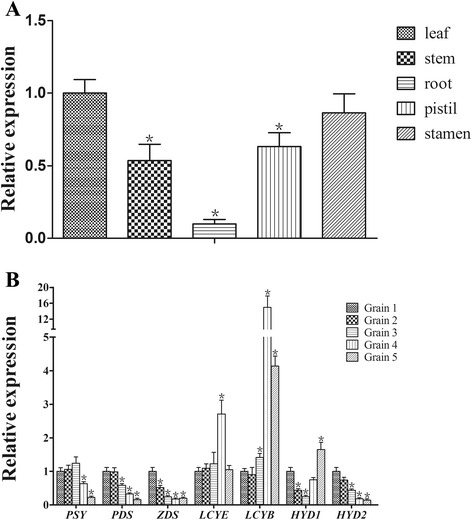
Figure 4.

Expression patterns of wheat TaLCYB revealed by qRT-PCR analysis. (A) Expression patterns of TaLCYB in different tissues. (B) Expression levels of the endogenous carotenoid biosynthetic genes in developing grains of common wheat. Poly(A)+ mRNA of 200 ng was subjected to reverse transcription, and served as the qPCR template. qPCR results for each gene were performed in three biological replicates with three technical repeats each and all data are shown as Mean ± SEM. Single asterisk indicates significant differences in the expression levels between controls at P = 0.05 probability level.
