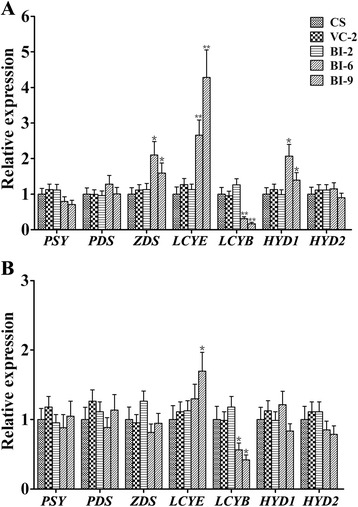
Figure 6.

Expression levels of the endogenous carotenoid biosynthetic genes in endosperms and leaf from transgenic and control wheat lines. Gene expression levels were measured by qPCR and are determined relative to the transcript levels of the constitutively expressed β-actin gene in the same samples. Expression levels of these genes for the transformed lines are given as expression levels relative to the values for non-transformed control line Chinese Spring (CS). qPCR results for each gene were performed in three biological replicates with three technical repeats each and all data are shown as Mean ± SEM. Single asterisk and double asterisk indicate significant differences in the expression levels between control CS and transgenic lines at P = 0.05 or P = 0.01 probability level, respectively.
