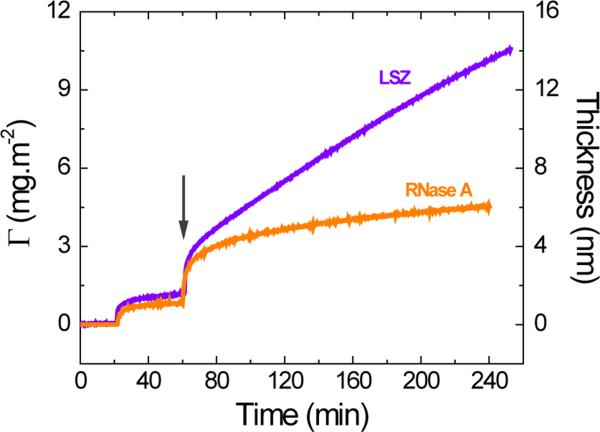
Figure 1.
Effect of applied potential on the kinetic of 0.10 mg·mL−1 LSZ and RNase A at OCP and after the application of external potential to the OTCE. Experiments were performed in 10 mmol·L−1 buffer solution at the IEP of the respective protein and a flow rate of 1 mL·min-1. The arrow shows the time at which the external potential was applied.

