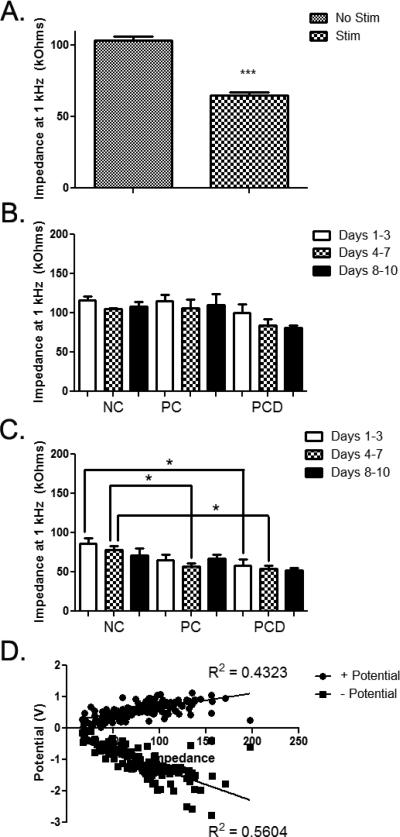
Figure 4.
In vivo electrode impedance (Z) at 1 kHz. A: With stimulation, there was a significant decrease in Z at 1 kHz when all coating conditions were combined. Error bars represent SEM. B: Impedance values at 1 kHz were grouped based on coating condition and time point in the study. No significant differences were observed across coatings and time points for electrodes that were not subjected to stimulation. Error bars represent SEM. C: Impedance values at 1 kHz were grouped based on coating condition and day of stimulation. Statistically significant decreases in Z were observed with the PC coating (4-7 days) and with the PCD coating (1-3 and 4-7 days) when compared to NC controls. Error bars represent SEM. D: Correlation between impedance and + potential and – potential. *p < 0.05: ***p < 0.001

