Figure 6.
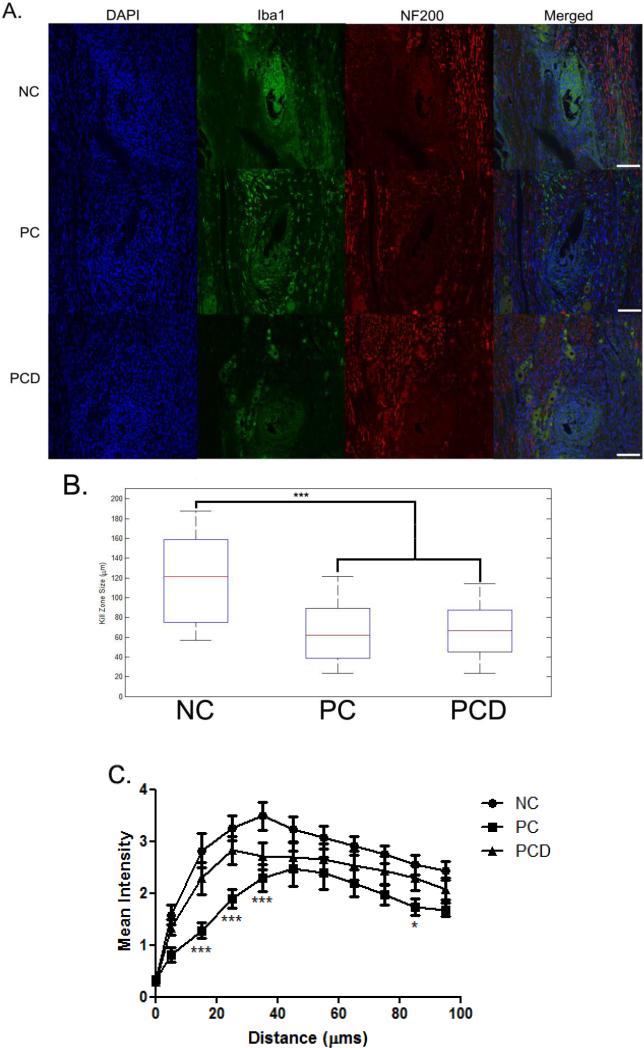
NF-200 and Iba-1 expression in the DRG after stimulation. Immunofluorescence images of rat DRG stained for NF200 (red) and Iba1 (green). NF200 staining was lacking in the area immediately surrounding the implant site and differences assessed by measuring the size of the area void of this staining. Iba1-positive cells were localized around the implant site and this increased immunoreactivity quantified and compared. A: Representative images from each of the coating conditions after stimulation are provided. B: Kill zone size was compared by coating condition, and significant decreases were observed for coated electrodes when compared to uncoated electrodes. C: Iba1 staining intensity as a function of distance from the electrode-tissue interface. Background staining was defined using corners of the analyzed image. Threshold values based on the background staining for each image were established, and Iba1 staining above this threshold measured as a function of distance from the implant site. The median intensity values were calculated in 10 μm bins and reported ± SEM. Scale bars represent 100 μm. *p < 0.05; ***p < 0.001

