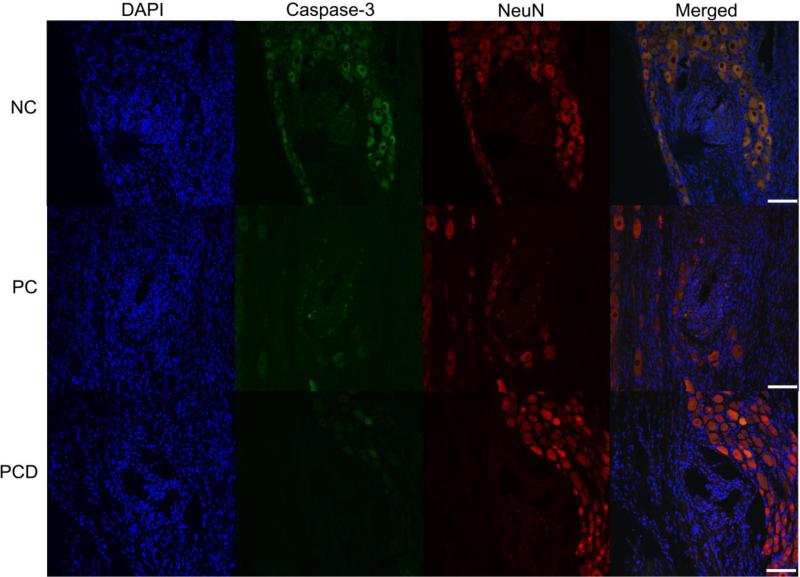
Figure 8.
Colocalization of NeuN and activated caspase-3 in the DRG. Immunofluorescence images were used to determine the degree of co-localization between NeuN (red) and cleaved caspase-3 (green) and representative images provided. The number of NeuN/caspase-3 positive cells was quantified and reported as a percentage of the total number of NeuN positive cells. Representative images are provided from each of the three coating conditions. Scale bars represent 100 μm.

