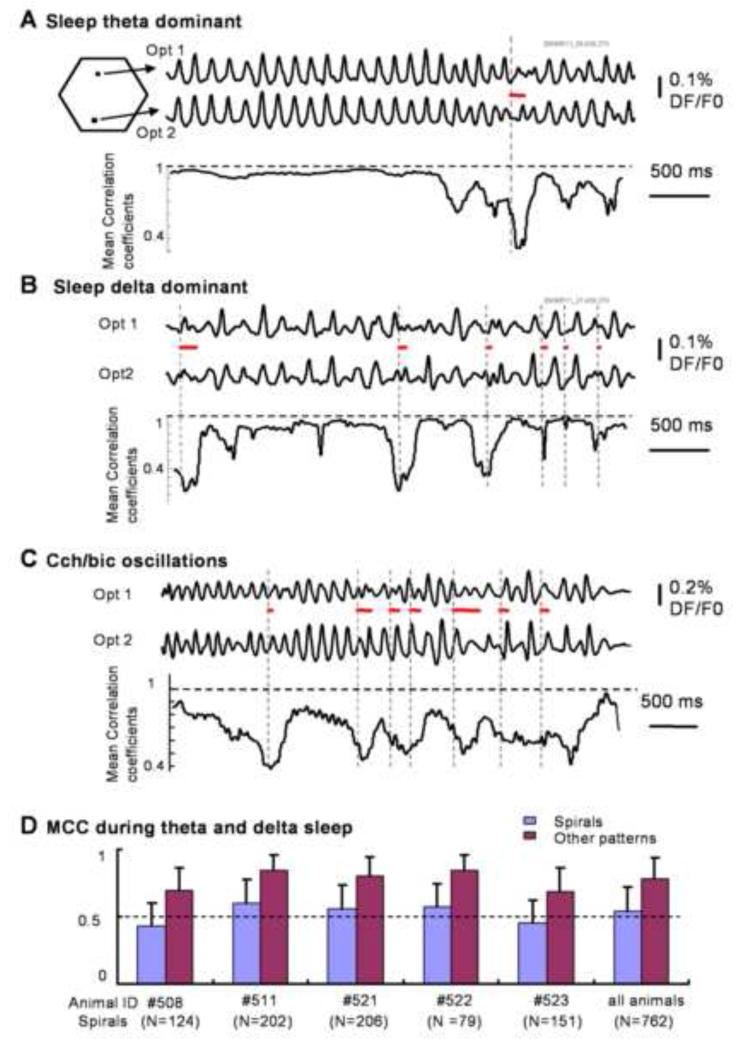
Figure 4. Spiral waves and spatial coherence.
A-C, top two traces are raw optical signals from two detectors (Opt1, Opt2, 2.5 mm apart). The bottom trace is the Mean Correlation Coefficient (MCC, methods section), calculated from all 464 detectors with a sliding window of 300 ms. The onset time and duration of the spiral waves are marked by the vertical broken lines and the red lines respectively. Spiral waves are correlated with decreases of MCC. D. Average of MCC measured from 5 animals during 762 spiral and non-spiral patterns. From each spiral wave (“spirals”), a 300 ms recording segment was selected. The “other patterns” were 300 ms of a recording segment without spiral waves randomly selected in the same recording trial.

