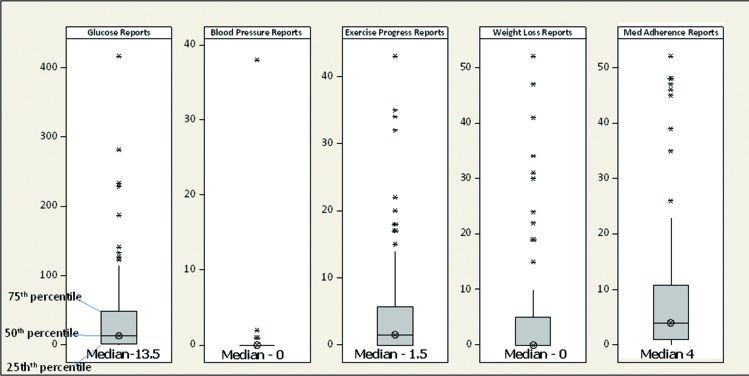
FIGURE 3.
Boxplots of report counts per patient. Boxplots indicate median, first-quartile, and third-quartile values for frequency of patient reports from different Care4Life prompts. Asterisks represent outliers (defined as 1.5 times the interquartile range). Glucose reporting occurred frequently (median 13.5 replies), whereas blood pressure and weight loss prompts received few replies (median 0). Med, medication.

