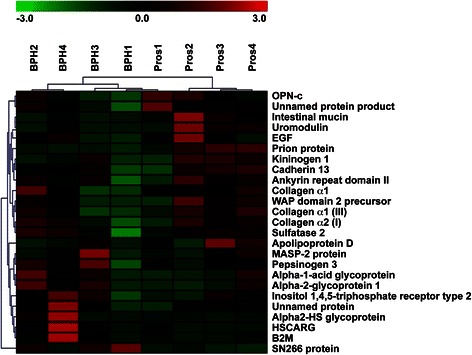
Figure 1.

Urinary proteins significantly differentially expressed between BPH vs. PCa identified by iTRAQ. The relative level of protein expression is shown with a pseudo color scale (−3 to 3), with red denoting up-regulation and green denoting down-regulation. The columns represent samples and the rows represent the proteins.
