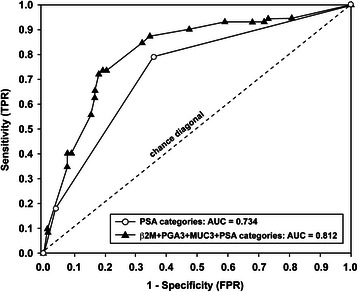
Figure 5.

Receiver operating characteristic curves for combined urinary biomarkers in differentiating BPH patients from PCa patients. White circles represent the ROC curve (AUC = 0.734) for three clinically relevant PSA categories (0–4, 4.1-10, >10 ng/mL). Black triangles signify the ROC curve based on the combination of three urinary biomarkers with PSA categories and demonstrate the highest diagnostic accuracy (AUC = 0.812), representing significant improvement (P = 0.004).
