
Figure 2.
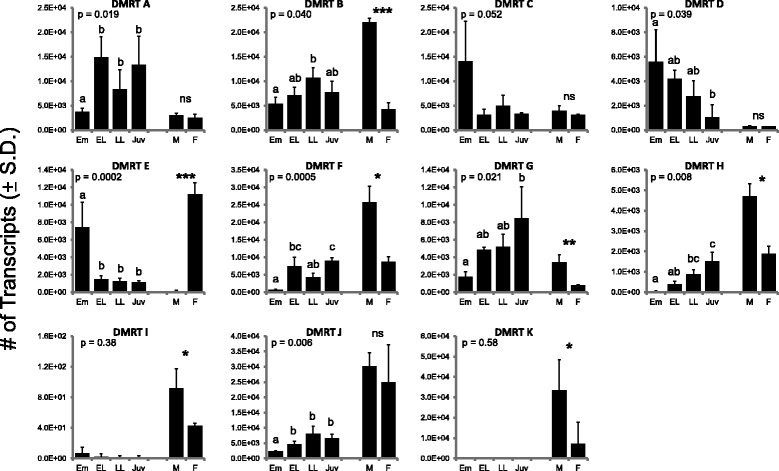
Quantitative PCR results for expression of 11 NvDmrt genes over a developmental series (Em = embryo, EL = early larvae, LL = late larva, Juv = Juvenile) and between males (M) and females (F). The developmental series results from statistical comparisons are shown with the P value, and letters above bars indicate statistical grouping based on post-hoc comparisons. Significant differences in gene expression between males are females are indicated with an asterisk (*P < 0.05; **P < 0.001; ***P < 0.0001). NS, no significant difference.