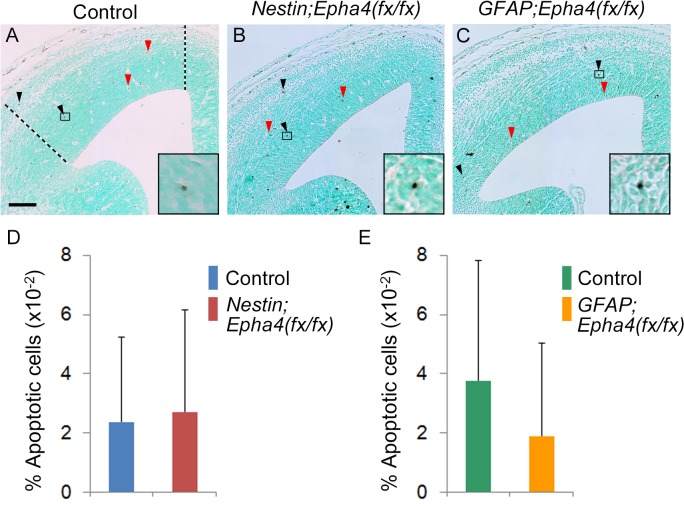
Fig 4. Apoptosis in the cortex.
A–C, Representative image of apoptotic cells in the cortex of control (A), Nestin;Epha4 fx/fx (B), and GFAP;Epha4 fx/fx (C) mice. Apoptotic cells were detected by TUNEL staining at E14.5. Apoptotic cells (black arrowheads) show intense dark black staining, whereas blood cells (red arrow head) exhibit light brown staining in the cytoplasm. The boxed areas are magnified (lower right insets) to show apoptotic cells. The number of apoptotic cells between the dotted lines in each section was counted. D and E, Quantification of the number of apoptotic cells detected in panels A, B, and C. The percentage of apoptotic cells per all cells between the dotted lines in Nestin;Epha4 fx/fx (D) and GFAP;Epha4 fx/fx (E) mice is shown. There was no significant difference in the percentage of apoptotic cells. N = 4 per genotype. Error bars represent SD. Scale bar, 100 μm.

