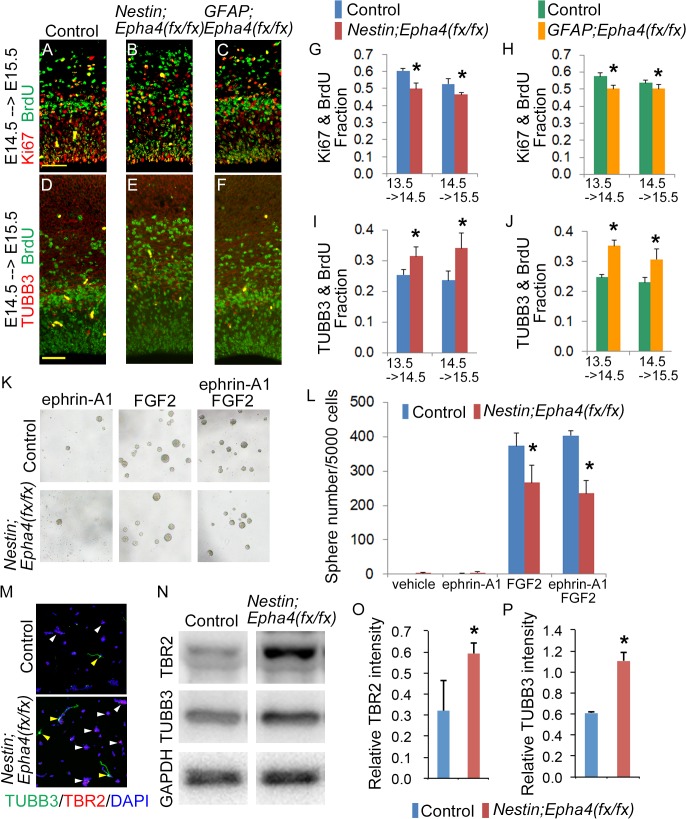
Fig 6. Self-renewal and differentiation of neural stem/progenitor cells.
A–J, Evaluation of the population of cells that re-enter and exit the cell cycle in Nestin;Epha4 fx/fx and GFAP;Epha4 fx/fx mice between E13.5 and E15.5. BrdU was administered to pregnant mothers 24 h before collecting E14.5 and E15.5 embryos. Coronal sections of the control and mutant cortices were co-stained for BrdU and Ki67 to detect the cell population that re-enters the cell cycle and co-stained for BrdU and TUBB3 to mark the cell population that exits the cell cycle. Ki67+BrdU+ cells represent proliferating cells that include RGCs and INPs, while TUBB3+BrdU+ cells represent differentiated neuronal cells. Representative immunofluorescent images at E15.5 for BrdU (green) and Ki67 (red) (A–C), and those for BrdU (green) and TUBB3 (red) (D–F). Quantification of the number of Ki67+BrdU+ cells (G, H) and TUBB3+BrdU+ cells (I, J) in Nestin;Epha4 fx/fx (G, I) and GFAP;Epha4 fx/fx (H, J) mice. In both mutants, the Ki67+BrdU+ cell to total BrdU+ cell ratio decreased around E14.5, whereas the TUBB3+BrdU+ cell to total BrdU+ cell ratio significantly increased relative to controls. These findings suggest that differentiation of RGCs and INPs to neurons is accelerated at this stage in mutants relative to controls. These changes are expressed quantitatively as the fraction of double stained cells relative to the total number of BrdU+ cells in the cortex. N = 5 per genotype, (*) P < 0.05. Error bars represent SD. Scale bars, 50 μm. K and L, Neurosphere formation from cortical cells isolated from Nestin;Epha4 fx/fx cortex in the presence of FGF2 alone, clustered ephrin-A1 alone, or FGF2 plus clustered ephrin-A1. Representative images of neurosphere formation (K) and the number of neurospheres in K (L). Fewer neurospheres grew from isolated Nestin;Epha4 fx/fx cortical cells than from control cortical cells. FGF2 increased the number of the neurospheres derived from control E14.5 cortex but not that from mutant E14.5 cortex, whereas clustered ephrin-A1 alone, a ligand for EphA4, did not affect neurosphere growth. M–P, Differentiation of neurospheres derived from control and Nestin;Epha4 fx/fx cortical cells. The cells from the E14.5 cortex were cultured for 4–5 days to form primary neurospheres. Cells from the primary neurospheres were replated to obtain a monolayer culture and used for immunostaining as described in the Materials and Methods. Representative image of neurospheres immunostained with markers for INPs (TBR2, red) and neurons (TUBB3, green) (M). There was a higher percentage of spheres with TBR2+ (white arrowheads) and TUBB3+ (yellow arrowheads) cells in the mutant (lower figure in M) than in controls (upper figure in M). Representative western blot analysis of TBR2 and TUBB3 in neurospheres from control and Nestin;Epha4 fx/fx mice (N) and quantification of TBR2 (O) and TUBB3 (P) signal intensities in neurospheres from control and Nestin;Epha4 fx/fx mice. The level of TBR2 and TUBB3 expression in the spheres increased in mutants compared to controls, showing that spheres of Nestin;Epha4 fx/fx are in a more differentiated state compared to control. N = 5 per genotype, (*) P < 0.05. Error bars represent SD.

