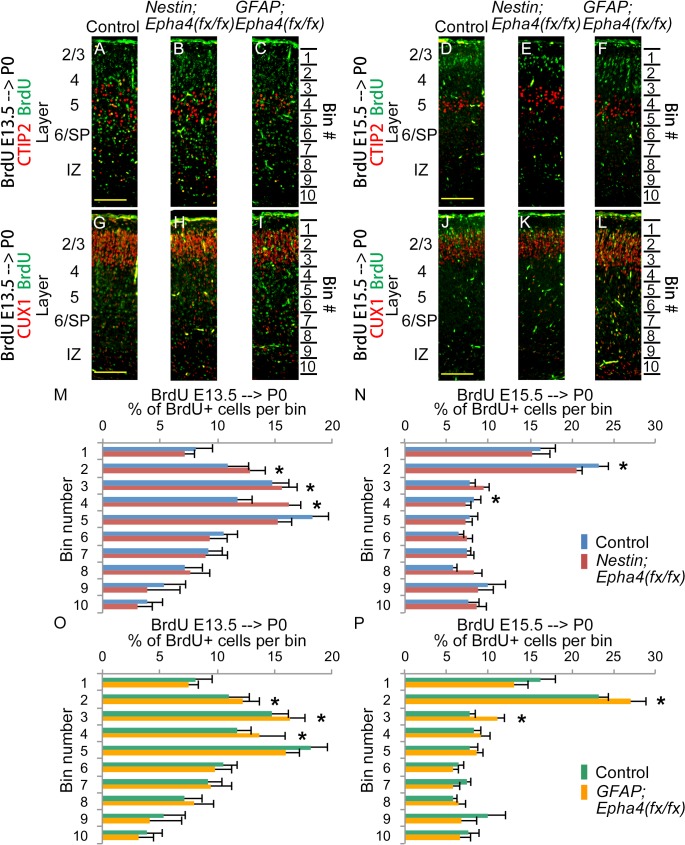
Fig 7. Positioning of cortical neurons born at E13.5 and E15.5 in P0 mice.
A–L, Representative immunofluorescent images showing the cortical distribution of BrdU-labeled cells (green) and markers (red) for layer 5 (CTIP2) and layers 2/3 (CUX1). Layer names are shown on the left of the images. M–P, Quantified distribution of BrdU+ cell numbers in 10 bins spanning the layers of the cortex. BrdU was injected to label proliferative cells that differentiate into migrating neurons at E13.5 (A–C, G–I, M, O) and E15.5 (D–F, J–L, N, P). The cortical distributions of these cells were analyzed at P0 in control (A, D, G, J), Nestin;Epha4 fx/fx (B, E, H, K) and GFAP;Epha4 fx/fx (C, F, I, L) mice. In Nestin;Epha4 fx/fx mice, a greater fraction of neurons born at E13.5 (M, red bar) was found in upper cortical layers compared to controls (M, blue bar), but a smaller fraction of cells born at E15.5 (N, red bar) was found in upper layers compared to controls (N, blue bar). In contrast, GFAP;Epha4 fx/fx mice exhibited a greater fraction of neurons born at both E13.5 and E15.5 (O and P, yellow bar) in upper cortical layers compared to controls (O and P, green bar). N = 3 per genotype, (*) P < 0.01. Error bars represent SD.

