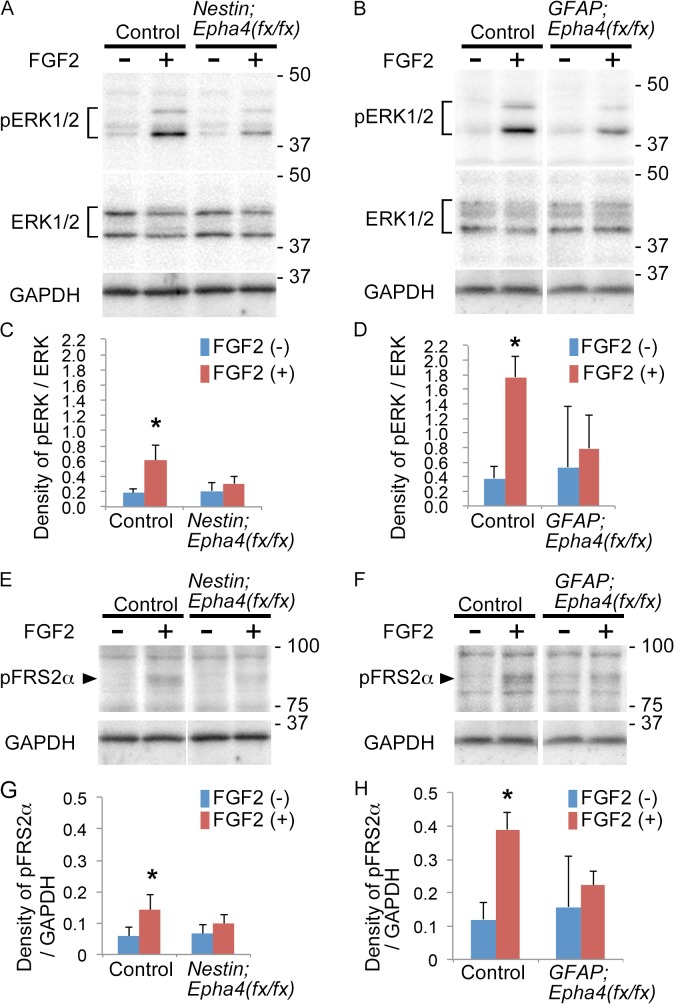
Fig 9. ERK1/2 and FRS2α phosphorylation in cortical cells in response to FGF2.
A and B, Representative western blot analysis of ERK1/2 phosphorylation (pERK1/2) in cortical cells from control and Nestin;Epha4 fx/fx mice (A) or GFAP;Epha4 fx/fx mice (B). Dissociated cells from the E15.5 telencephalon were stimulated for 20 min with FGF2 after 1 h starvation and lysed immediately. Stimulated and non-stimulated cells are marked by + or—, respectively. Total ERK1/2 expression (ERK) was used to show equal sample loading. C and D, Quantification of pERK1/2 and ERK1/2 signal intensities in the cortical cells stimulated with FGF2 (+) or not (-) in Nestin;Epha4 fx/fx (C) and GFAP;Epha4 fx/fx (D) mice. E and F, Representative western blot analysis of FRS2α phosphorylation (pFRS2α) in cortical cells from control and Nestin;Epha4 fx/fx mice (E) or GFAP;Epha4 fx/fx mice (F). Cells from the E15.5 telencephalon were examined as described above. GAPDH expression was used to show equal sample loading. G and H, Quantification of pFRS2α and GAPDH signal intensities in cortical cells stimulated with FGF2 (+) or not (-) in Nestin;Epha4 fx/fx (G) and GFAP;Epha4 fx/fx (H) mice. ERK1/2 and FRS2α phosphorylation levels were much lower in both mutants compared to controls. Molecular size markers are shown in kDa on the right side of the western blot lanes. N = 5 per genotype, (*) P < 0.05. Error bars represent SD.

