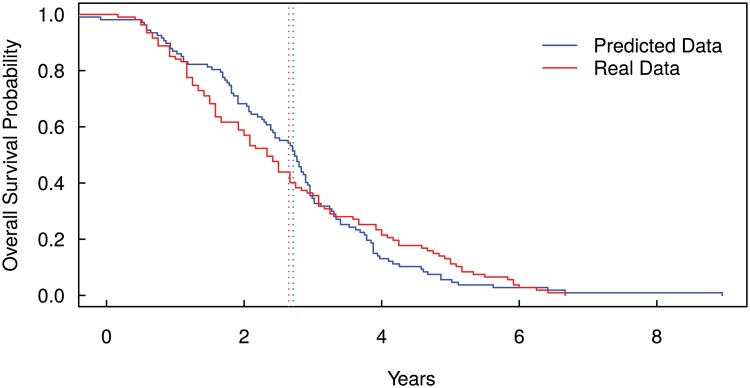
Fig 5. Kaplan-Meier curves for Overall Survival Probability Prediction.
The figure shows the comparison between the real survival curve provided by a breast cancer dataset (accession number GSE2034) and the survival curve predicted by the model shifted back of 2 years. The shifting back was necessary because the model describes the time from the first driver mutation to the death, while the follow up period provided by the real data starts when the cancer has been diagnosed. The dotted lines show the median overall survival times (real data 2.65 years and predicted data 2.71 years).

